Trade ChartFree
A chart that tells you the trend and the structure in plain words
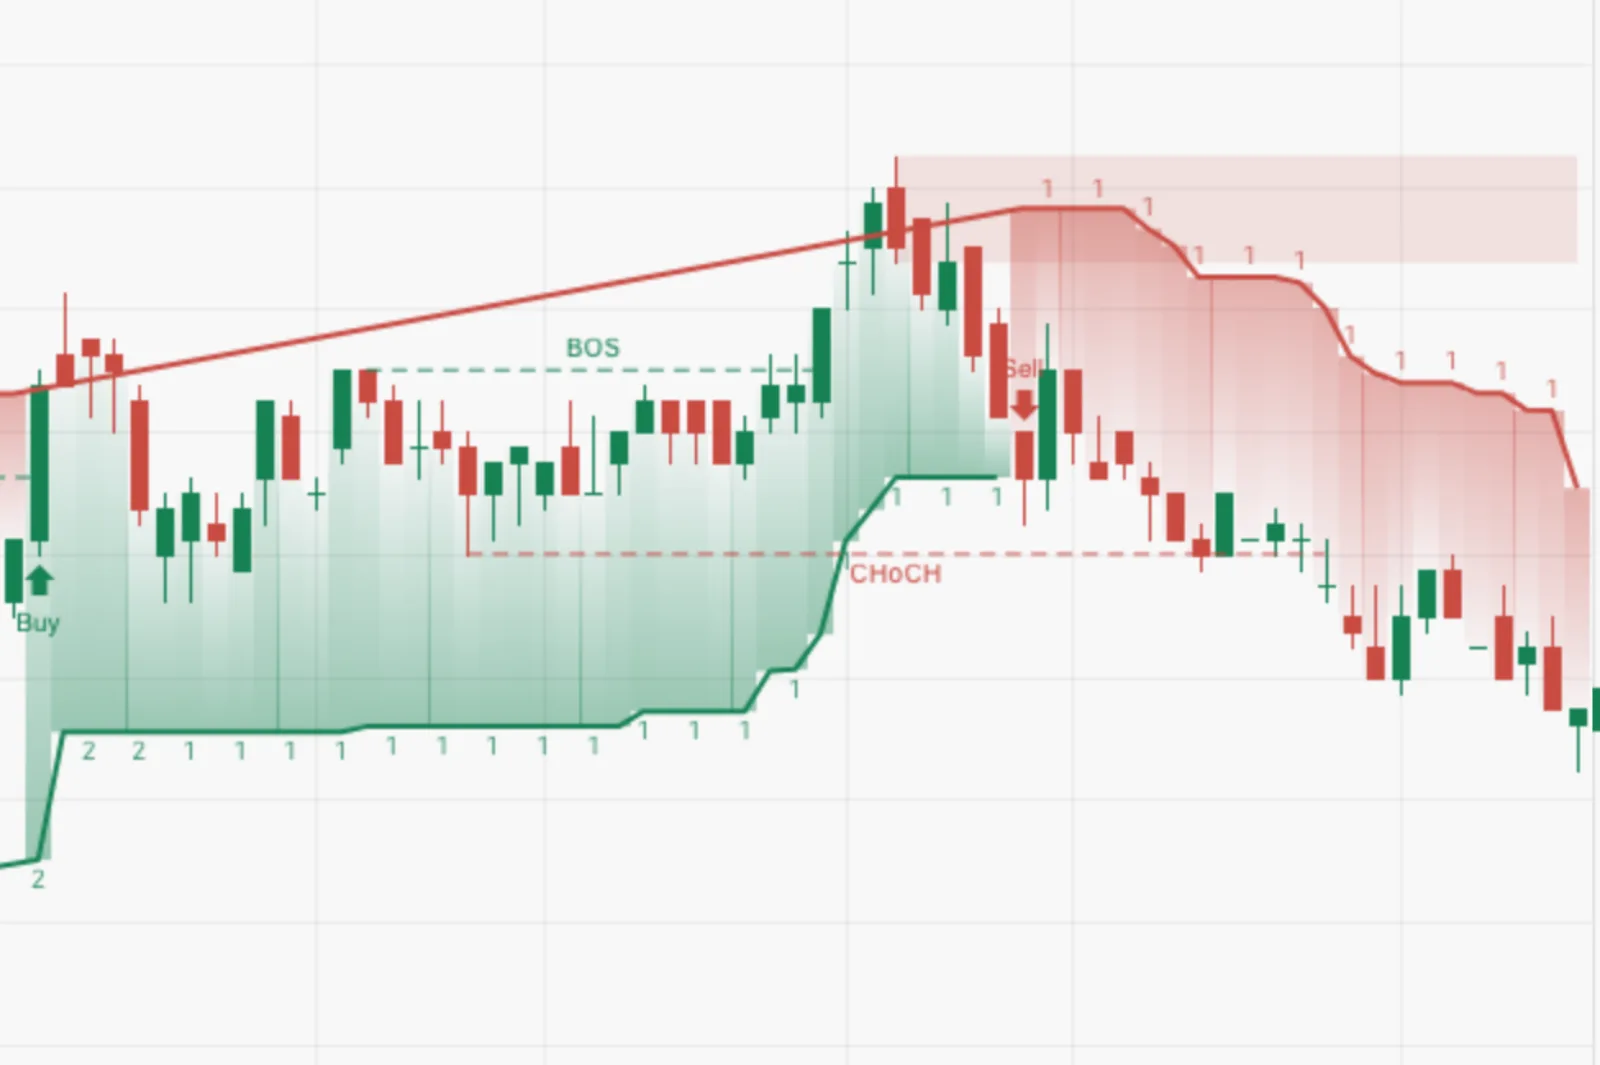
A candle chart that reads the trend for you: a stop line that adapts to volatility, market structure marked in plain words, and drawing tools that measure price, dates and volume.
Structure
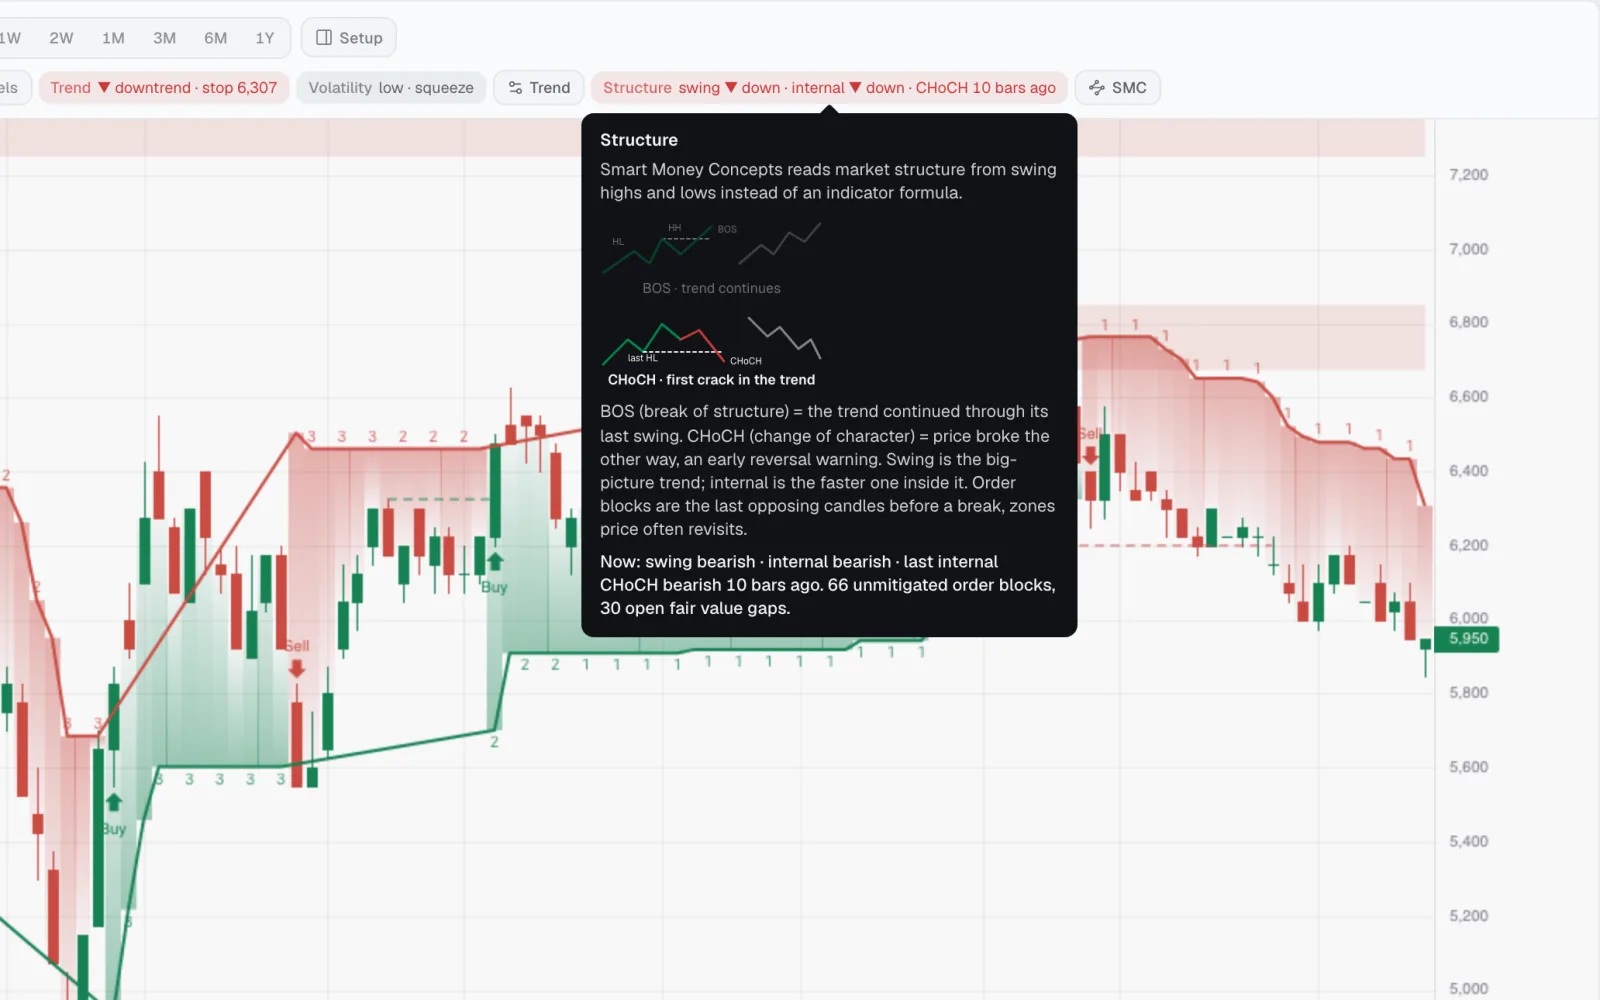
Market structure, named in plain words
Breaks of structure, changes of character, order blocks and fair value gaps, each explained on hover.
Drawing
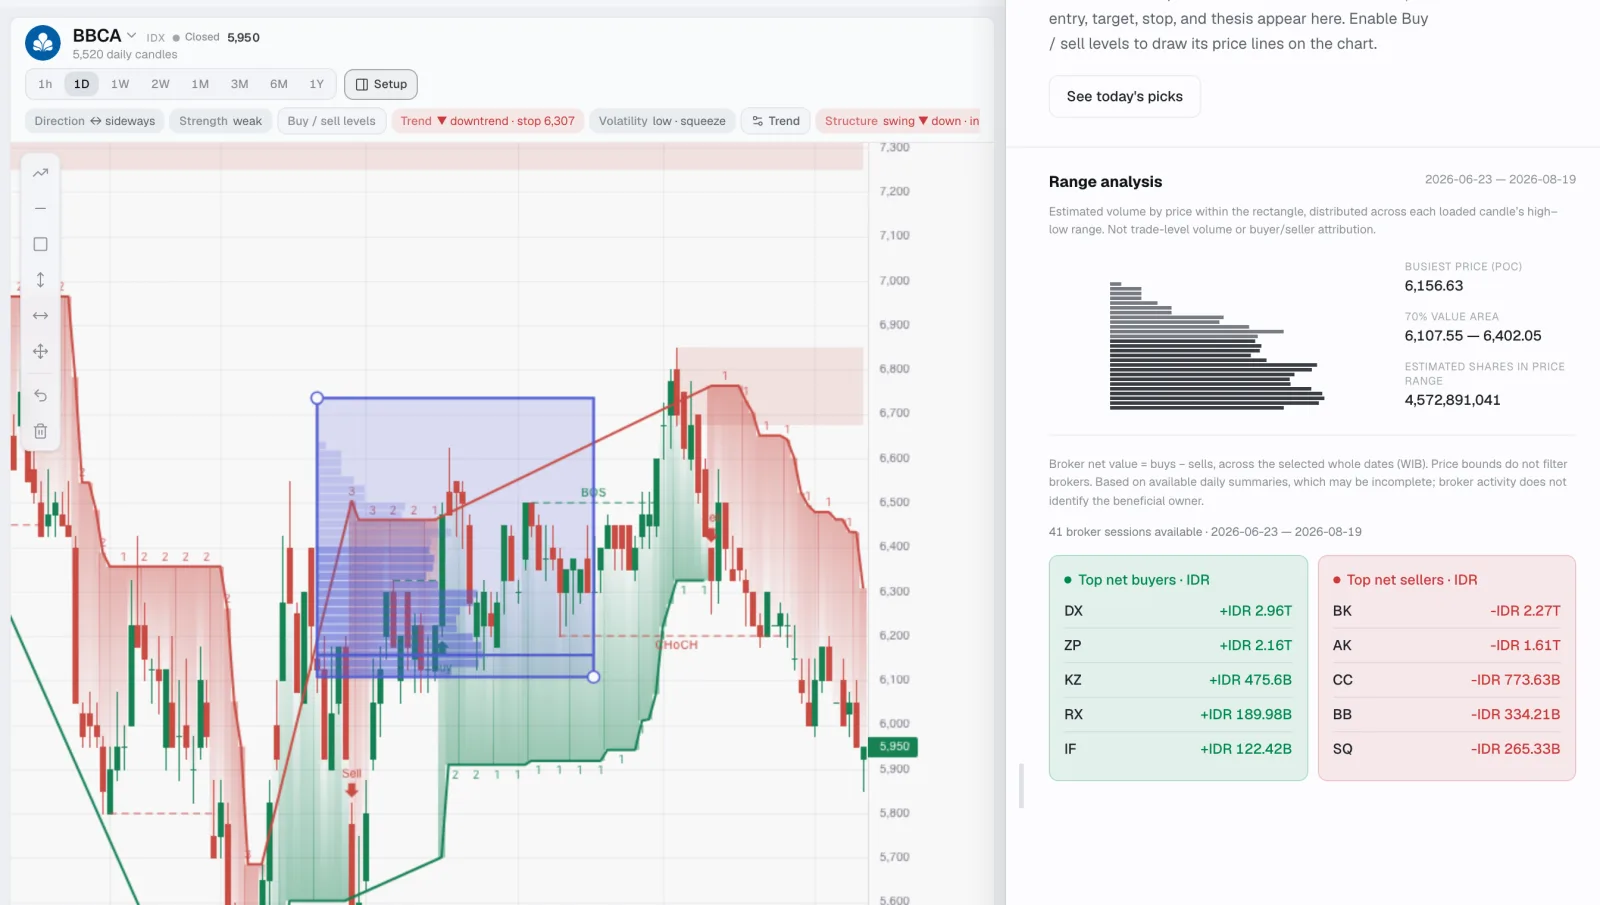
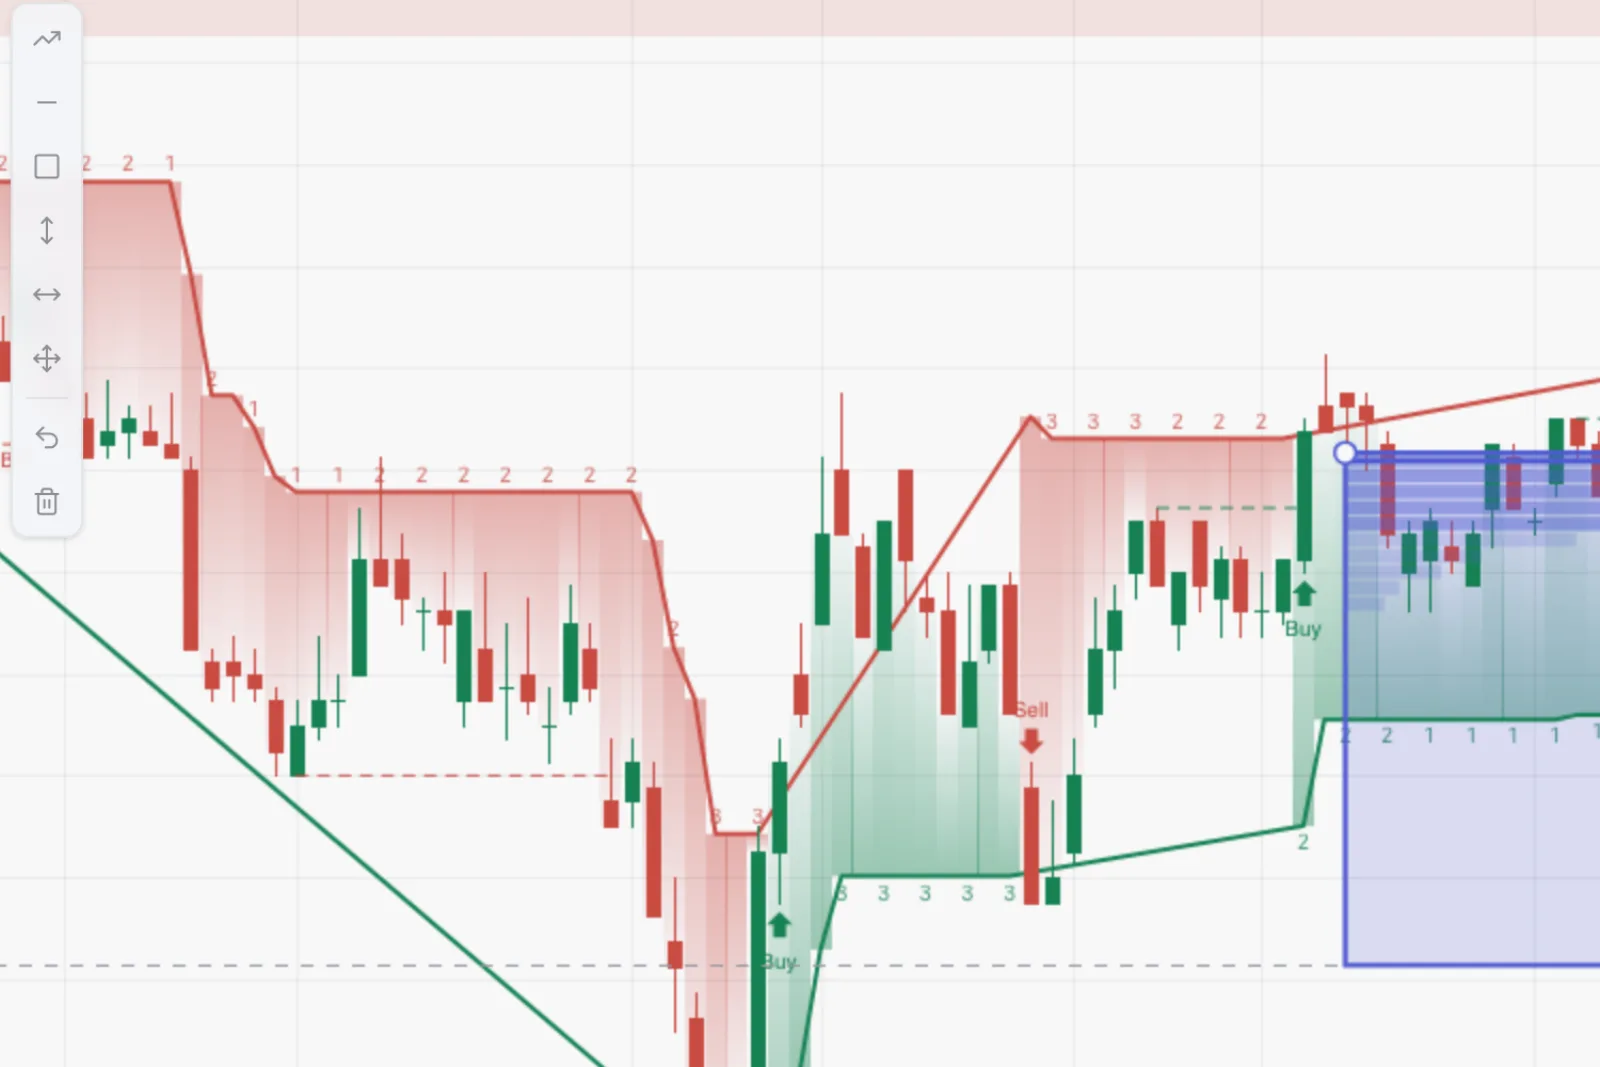
Mark it up and measure the move
Trend lines, levels and boxes that stay anchored, plus measurers for price, dates and volume.
What you get
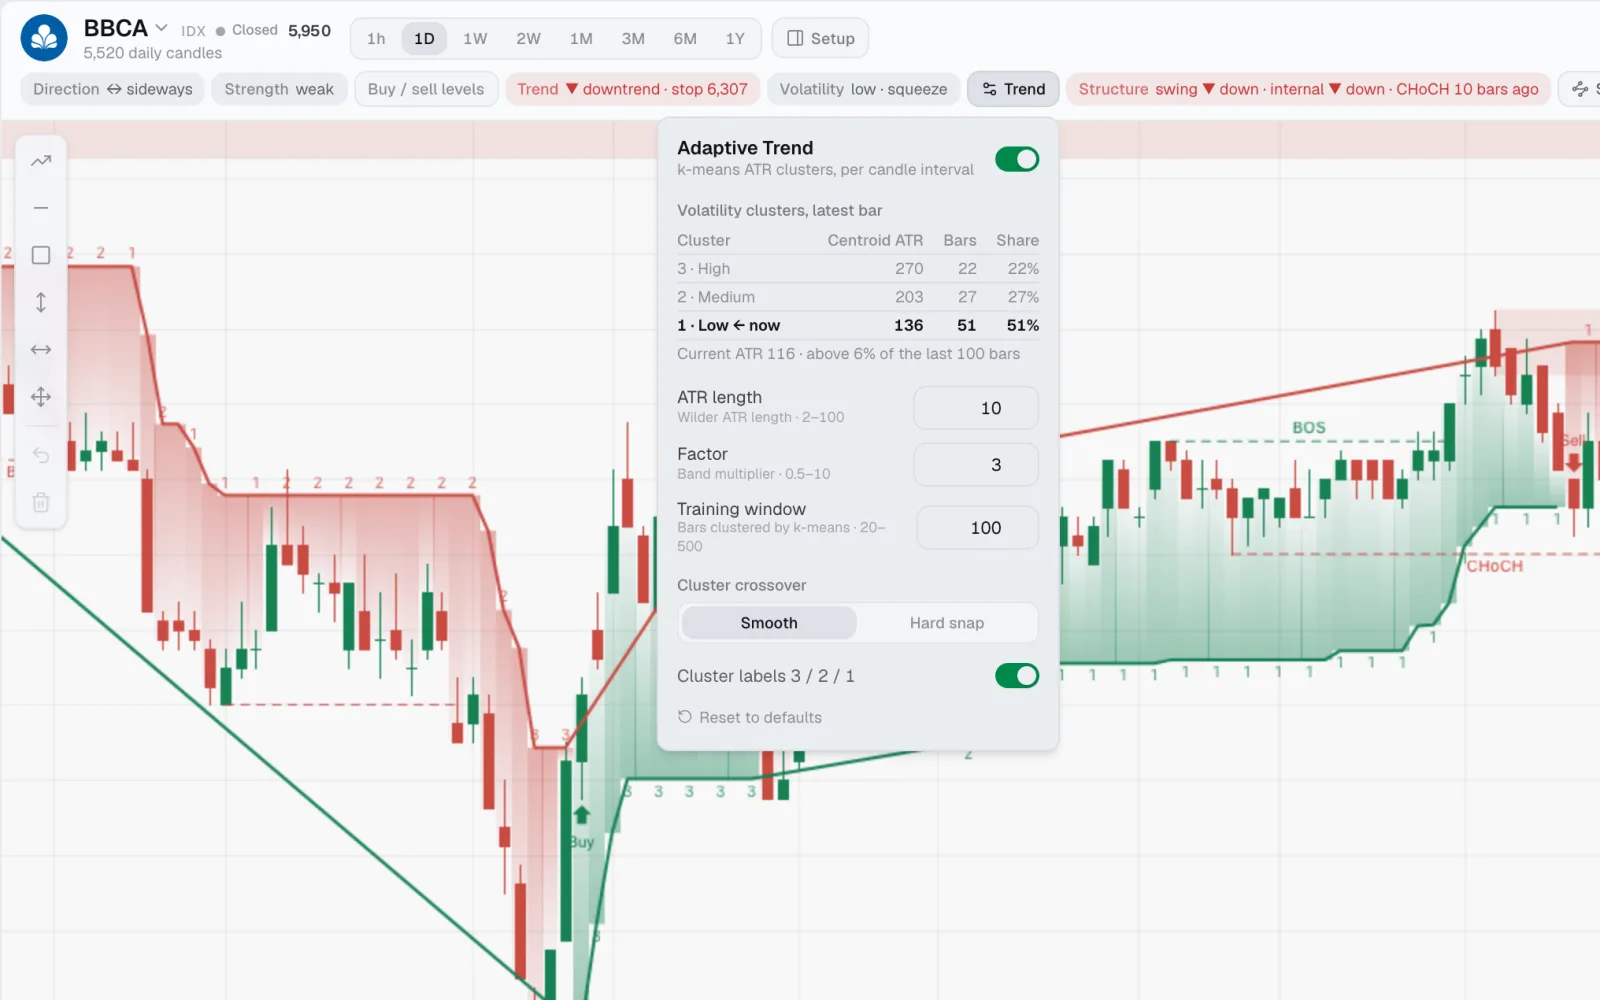
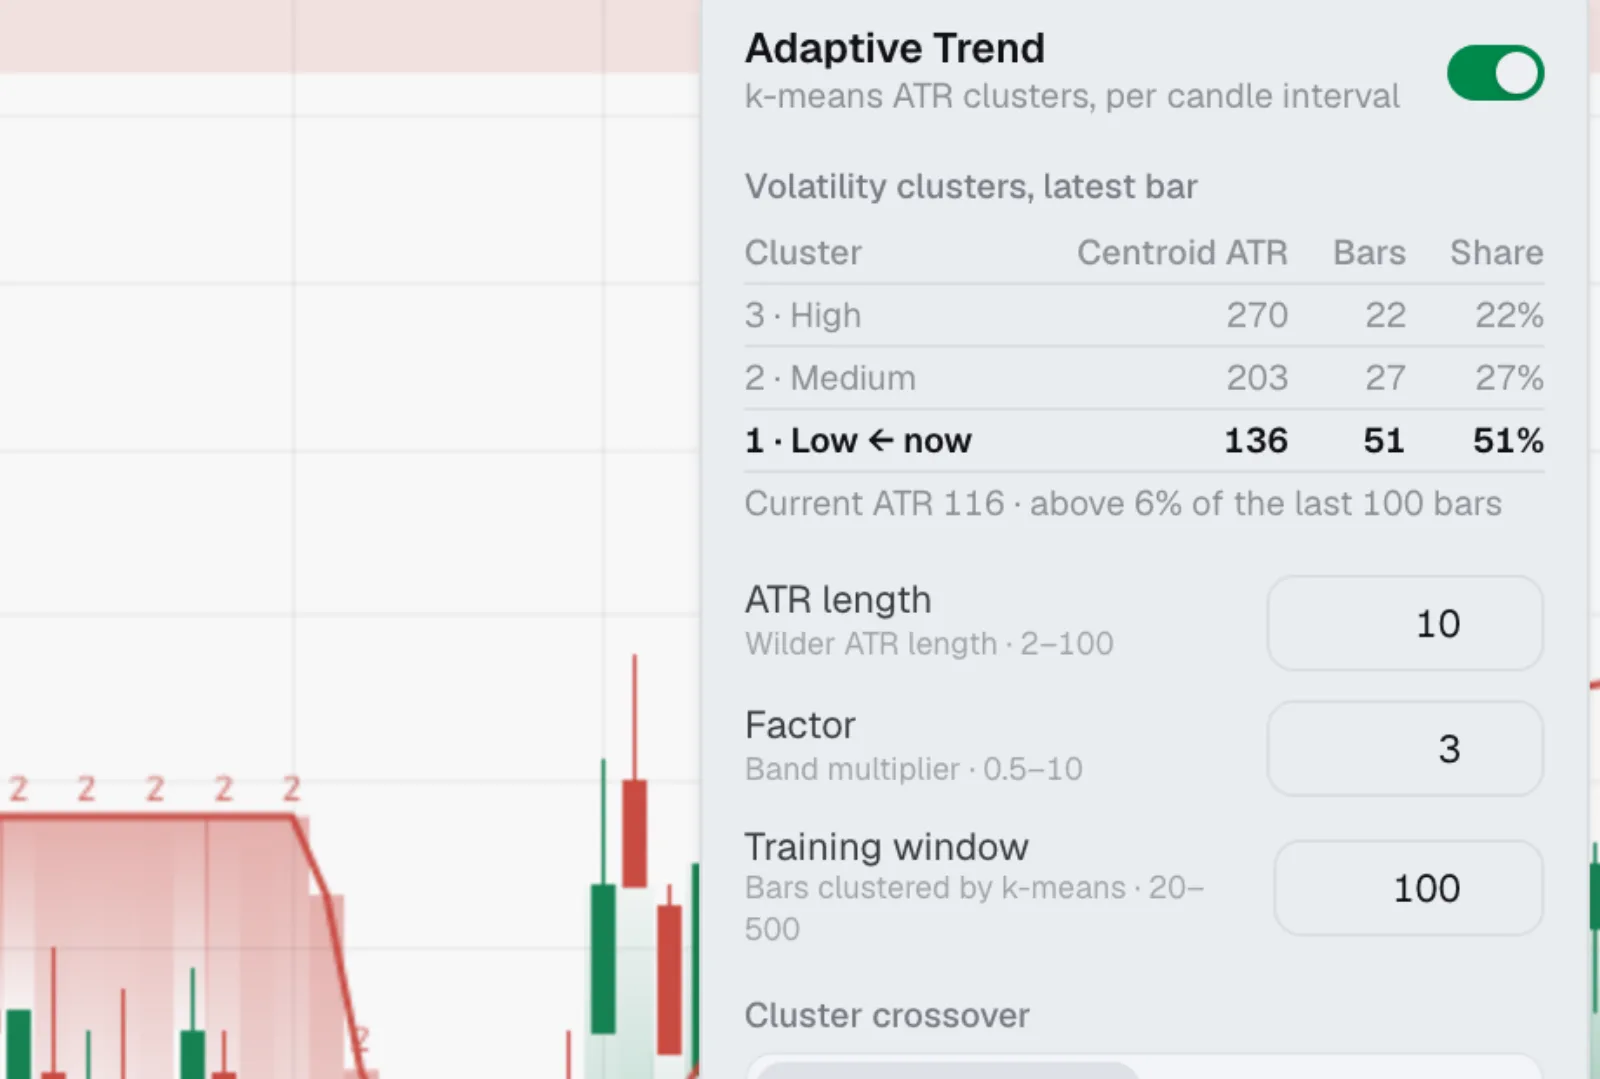
Adaptive Trend
Volatility grouped into high, medium and low.
Structure in plain words
Every label has a hover explanation.
Eight intervals
From 1-hour to 1-year candles.
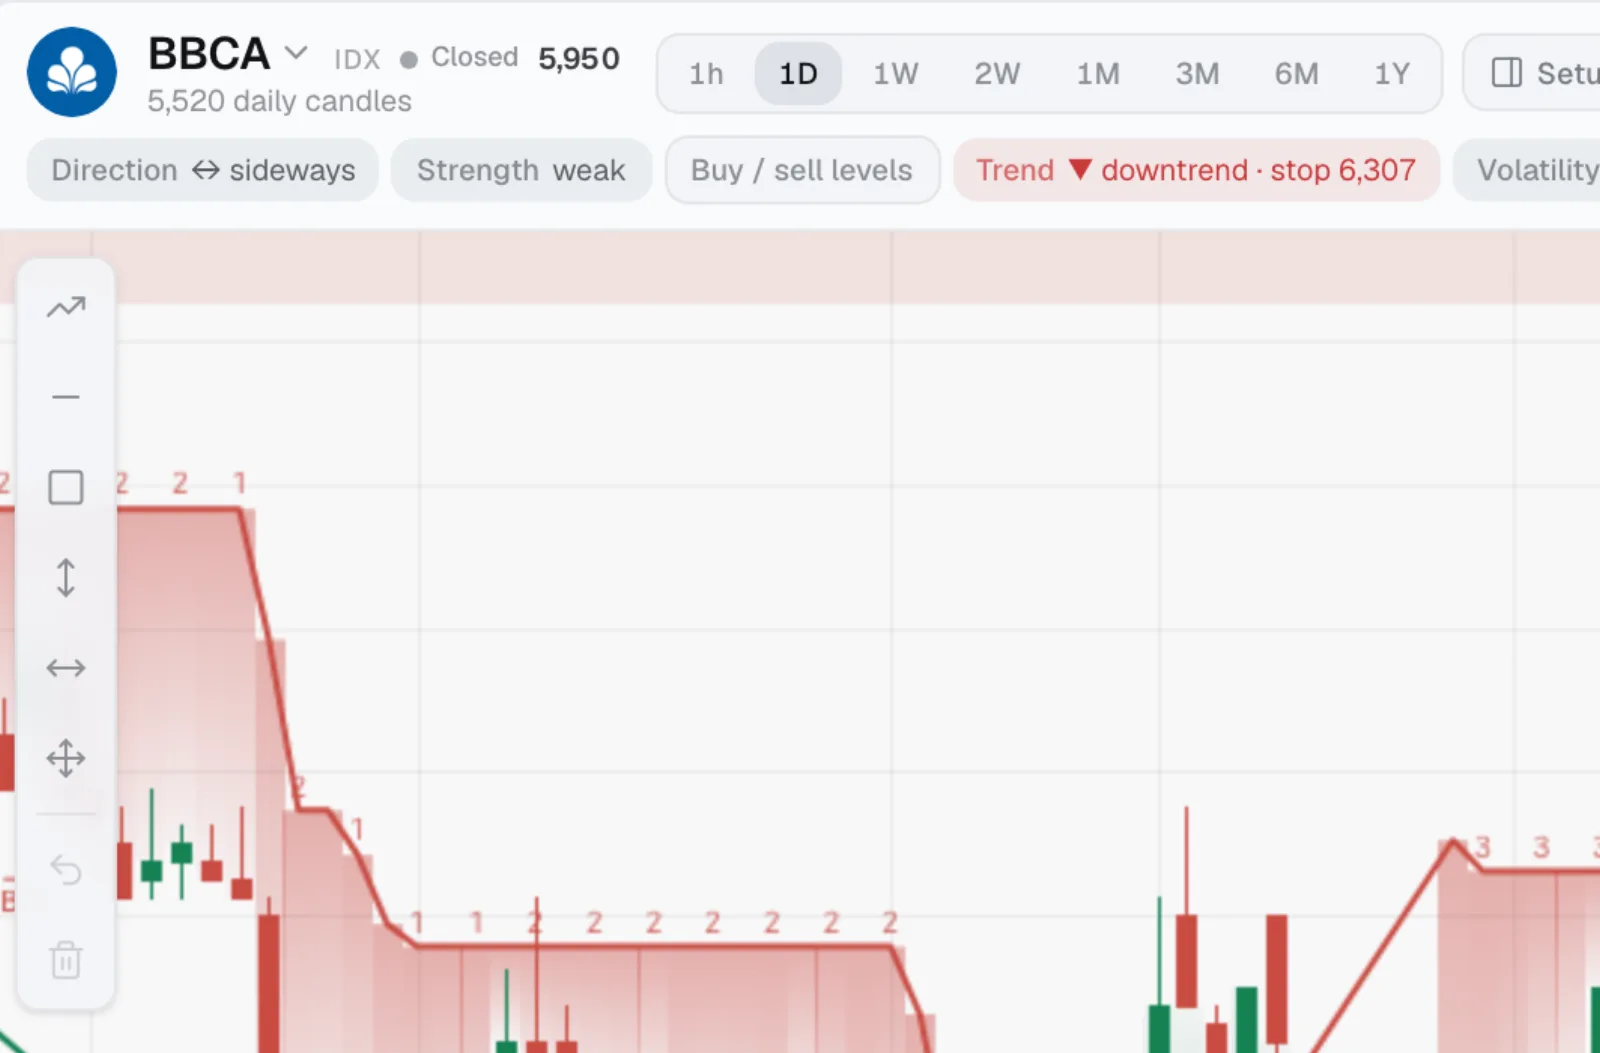
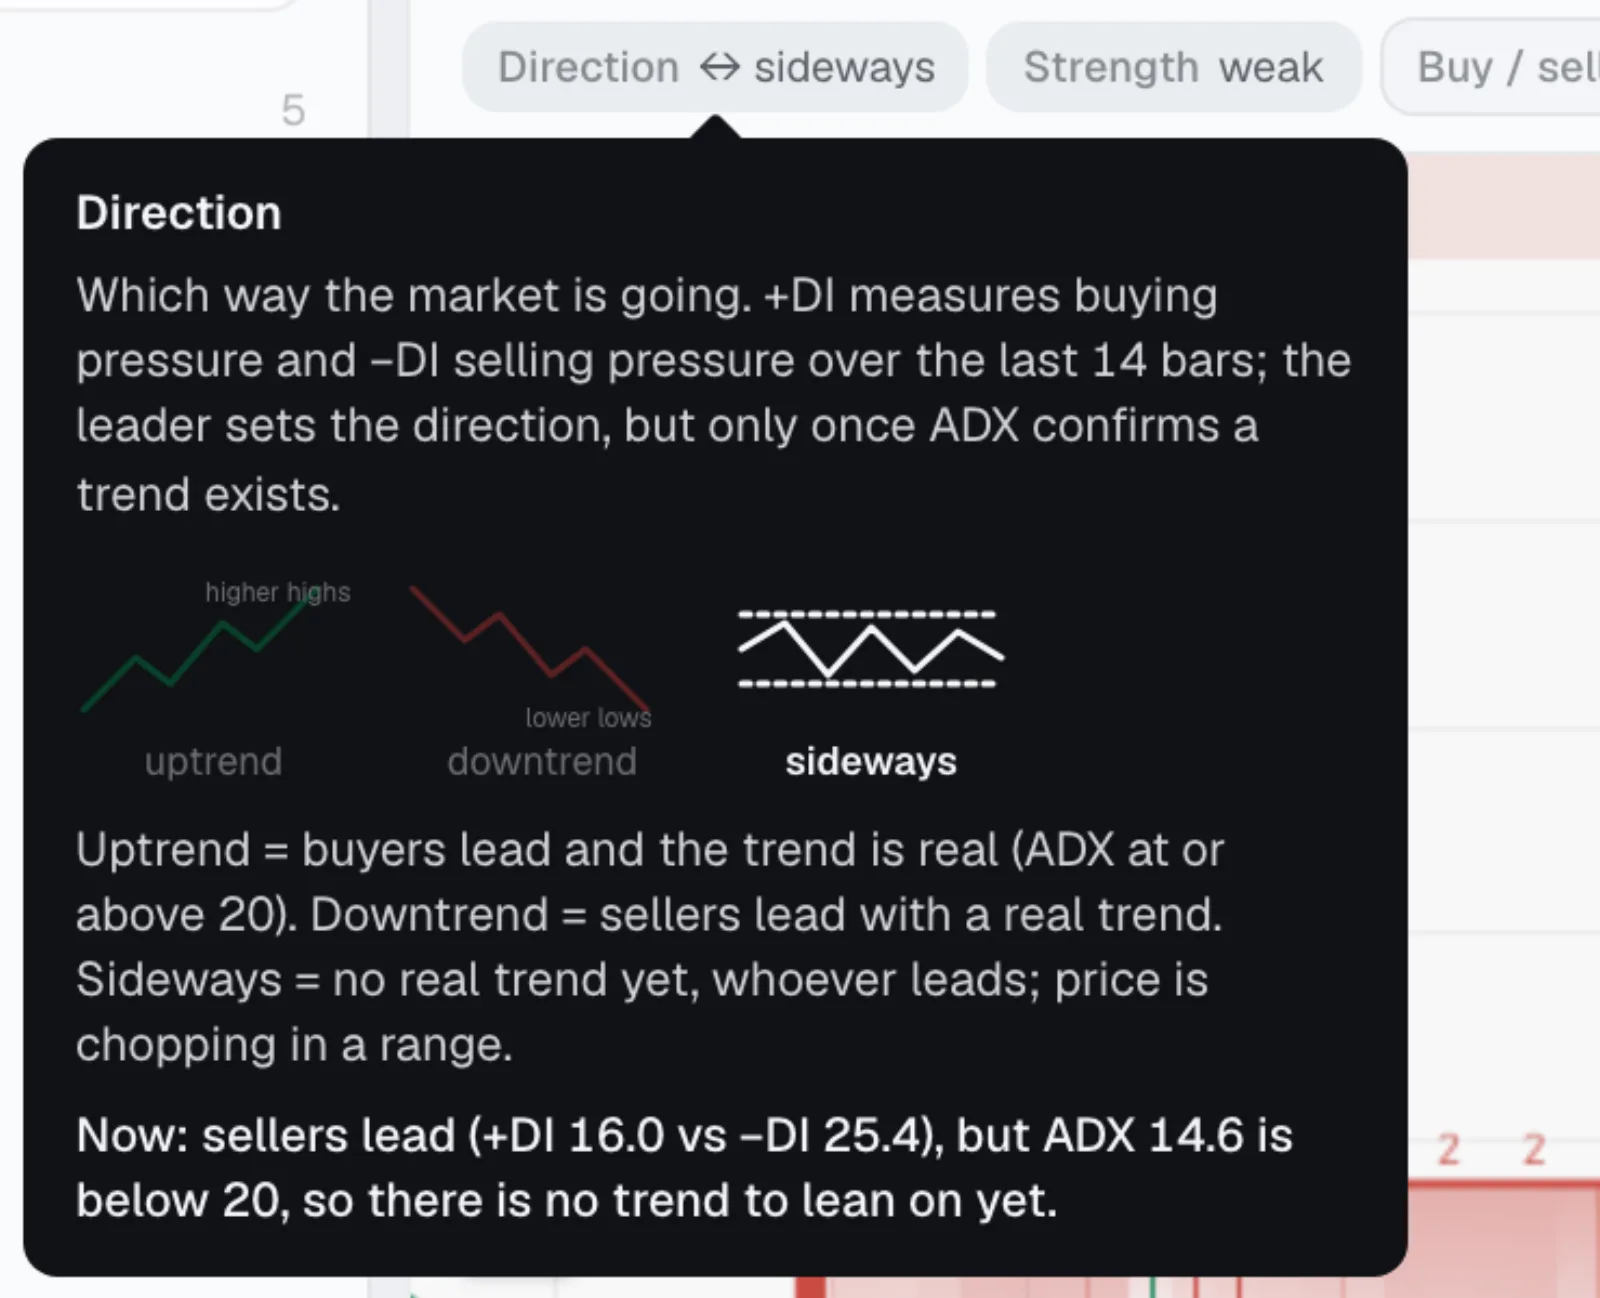
Five-part read
Direction, Strength, Structure, Trend and Volatility up top.
Draw and measure
Points, percent, bars, time and volume.
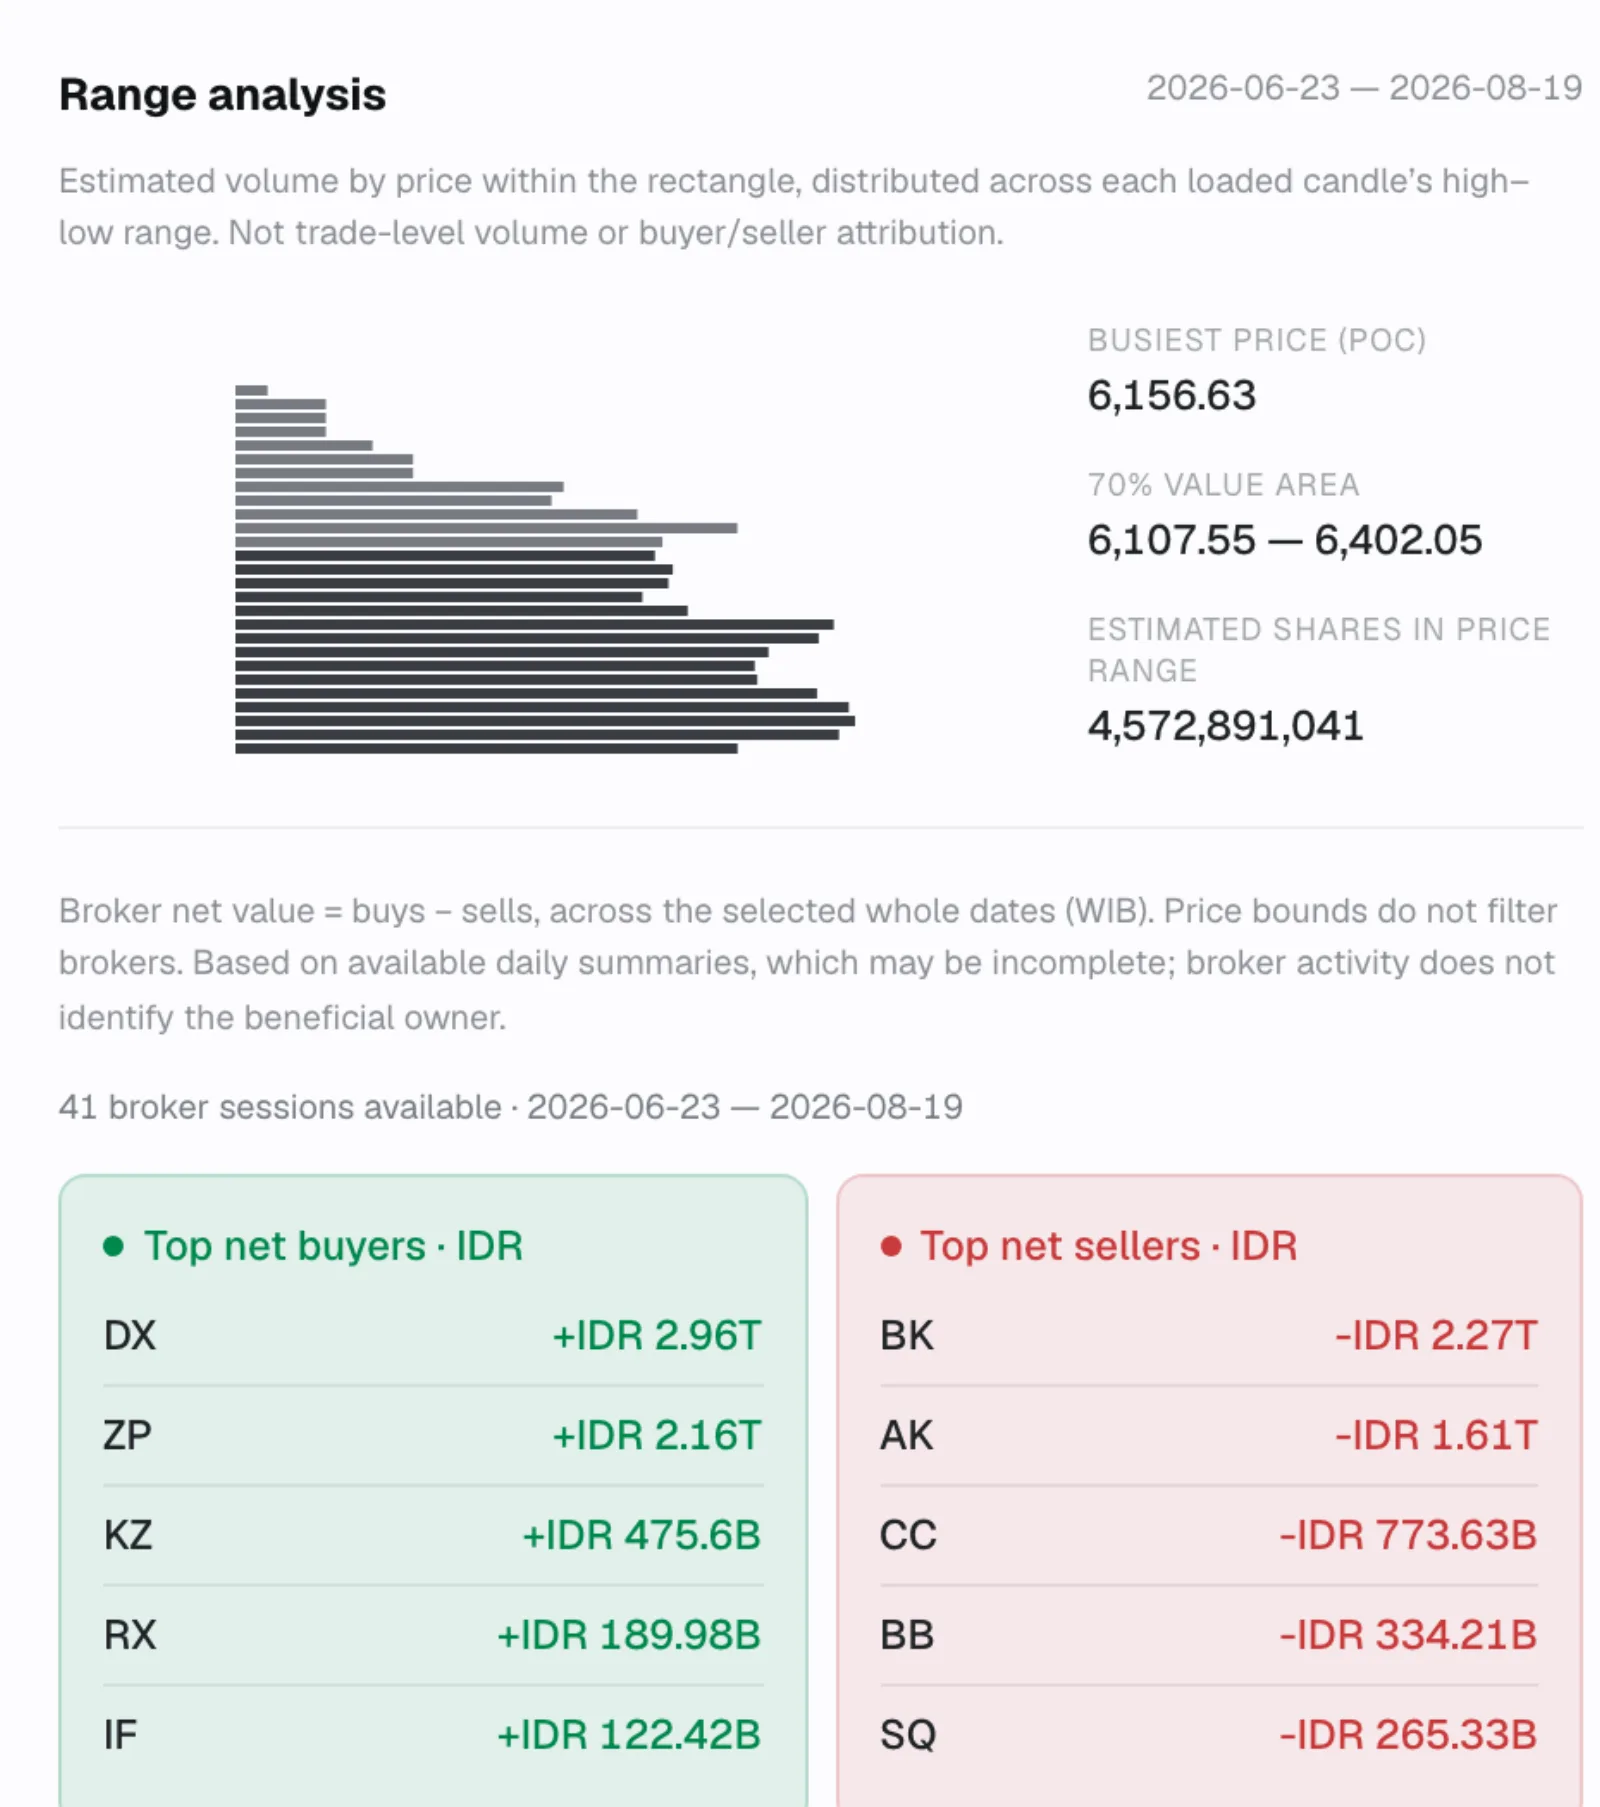
Volume by price
Busiest price, value area and top net brokers.
Questions
01Is Trade Chart free?
Yes. Charts, including Trade Chart, are on the Free plan.
02What does the Trend line actually tell me?
Trend is a stop line that sits below price in an uptrend and above it in a downtrend. Its distance adapts to recent volatility, and the cluster label shows whether the market is in a high, medium or low volatility state.
03Can I change the settings?
Yes. Trend has ATR length, factor, training window and smoothing; the structure overlay has swing length, order block counts, mitigation and more. Each has a reset to defaults, and settings are remembered in your browser.
04Is the volume in Range analysis real trade volume?
It is an estimate spread across each candle's high-low range, and the panel says so. It shows where volume likely concentrated, with the busiest price and a 70% value area.
05Does it show a screener's entry, target and stop?
When a screener has an open call on the symbol, a Trade setup panel shows its entry, target, stop and thesis, and a Buy / sell levels button draws those lines on the chart.