Broker summaryFree
See which brokers are accumulating or distributing each IDX stock
A broker by ticker heatmap shows who is net buying and selling, with watched brokers, contested names and each broker's track record.
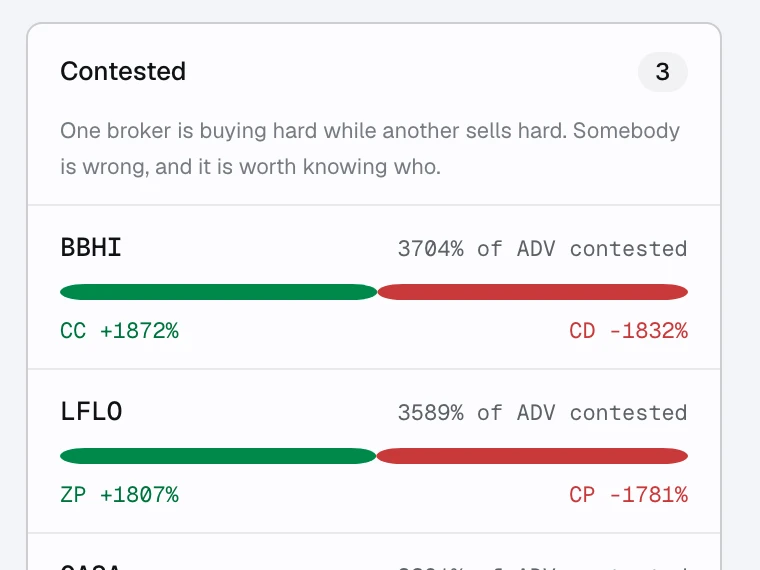
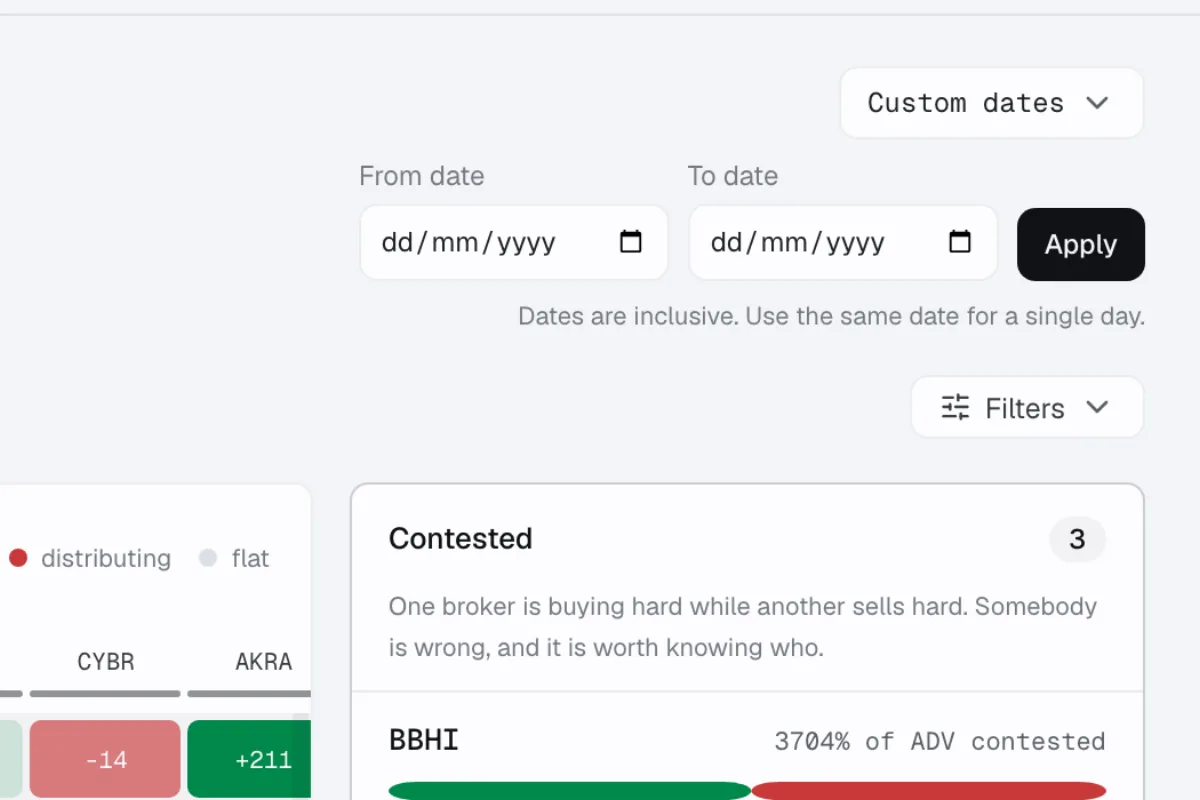
Contested
Find names where brokers disagree
Contested lists tickers where one broker buys hard while another sells hard; Consensus lists names where every active broker leans the same way.
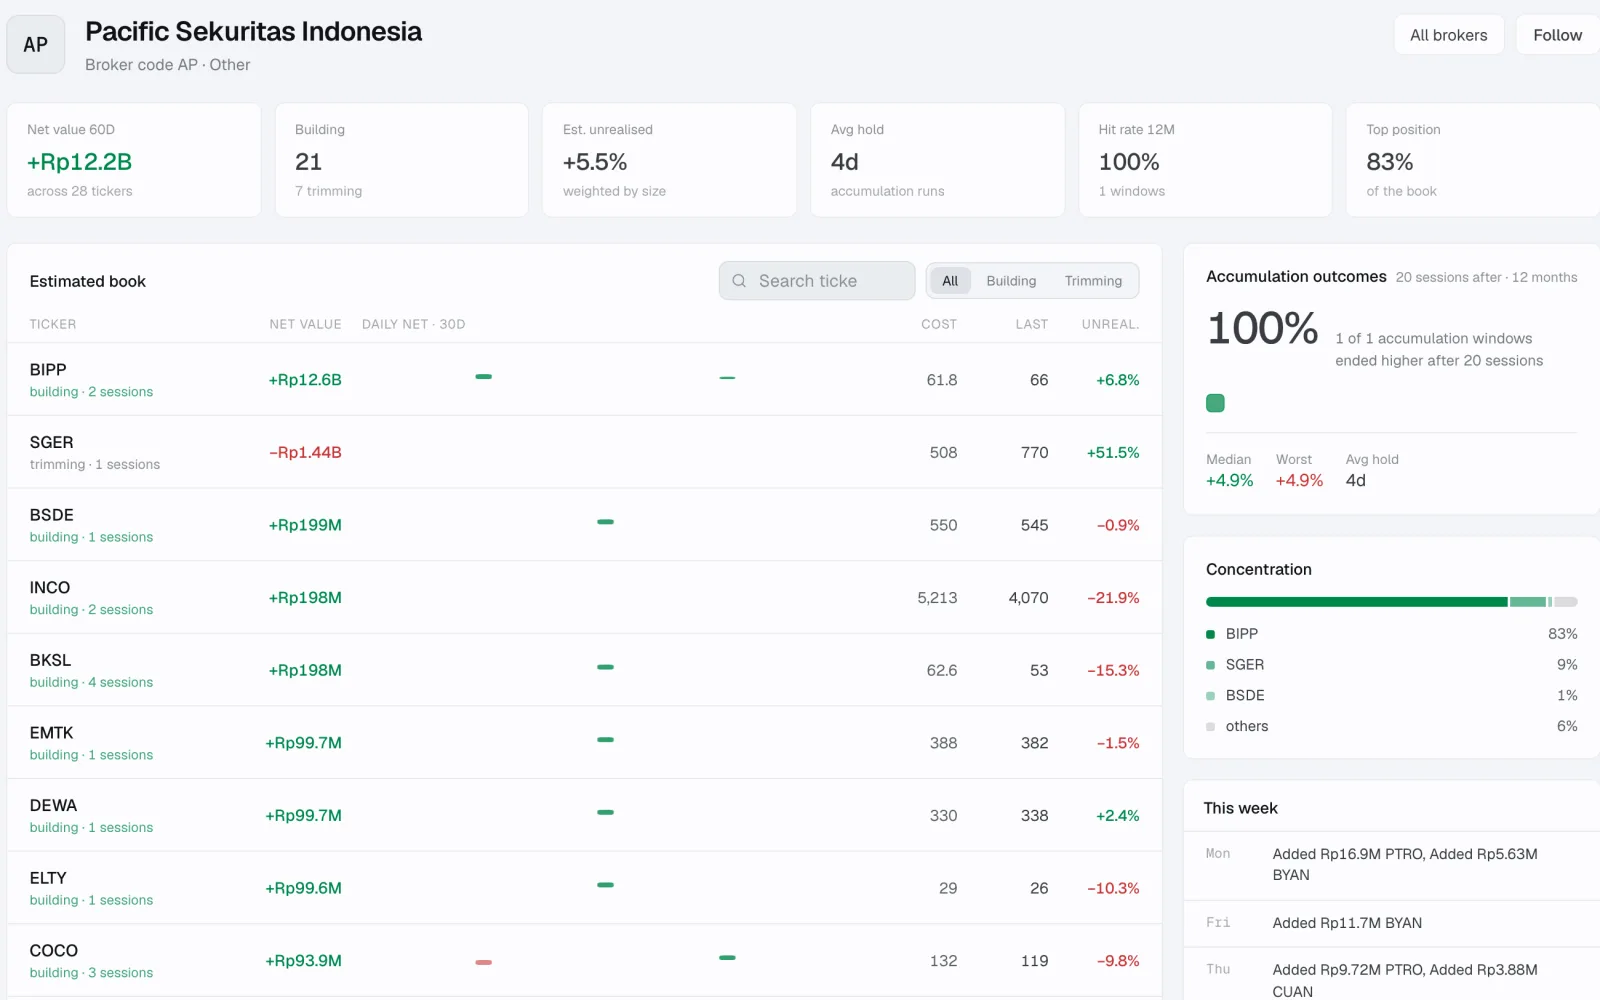
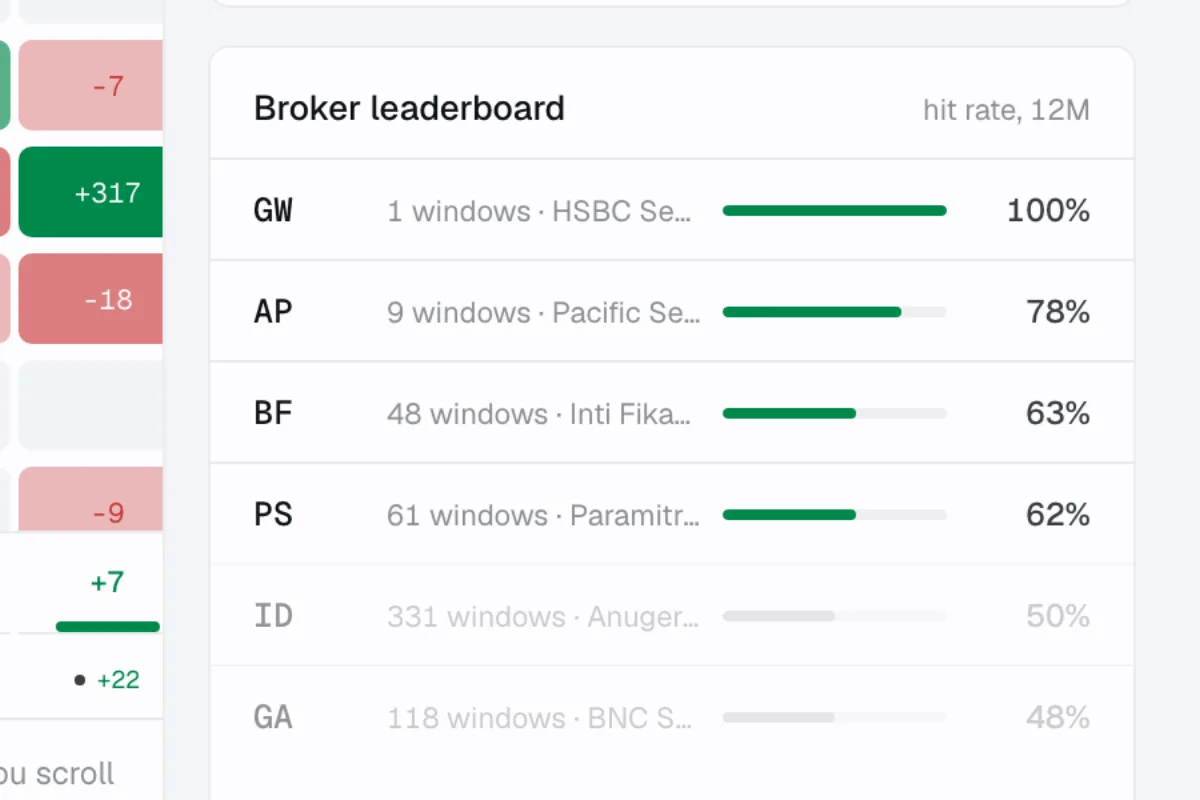
Track record
Judge a broker by its past results
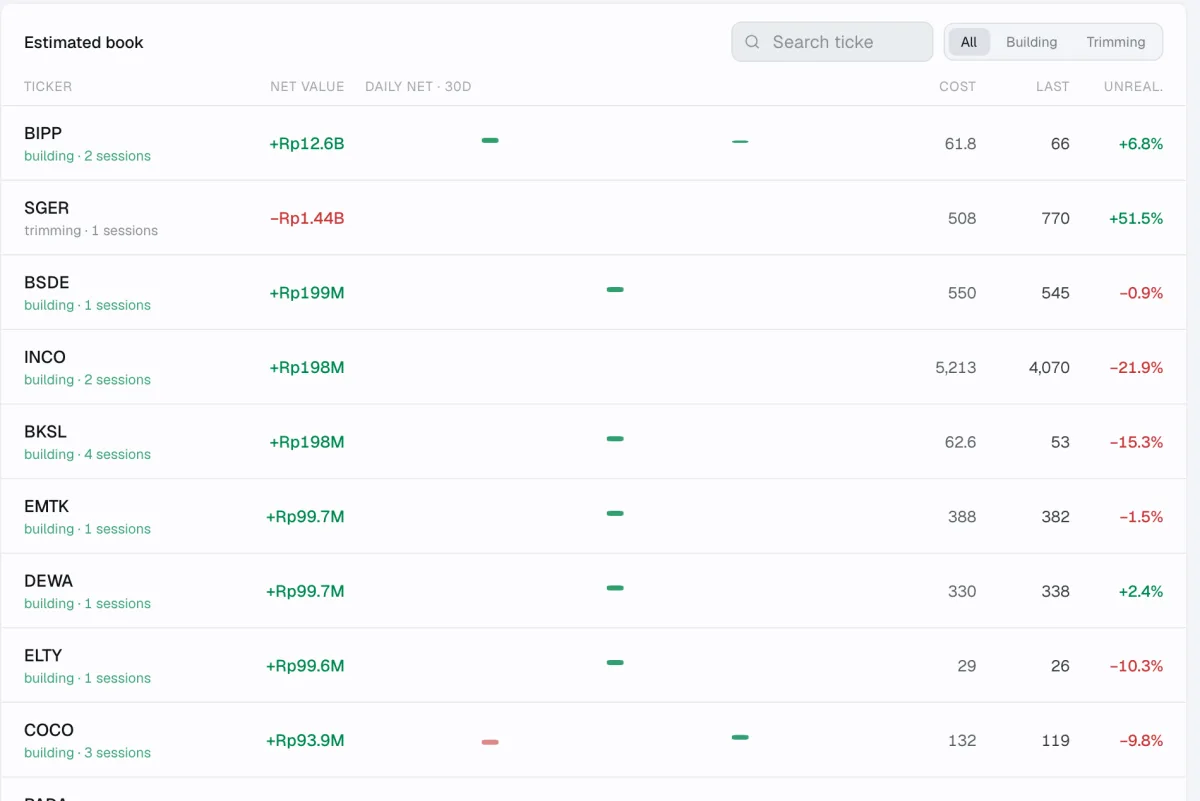
Each broker page shows its estimated book and how often its accumulation windows ended higher after 20 sessions.
What you get
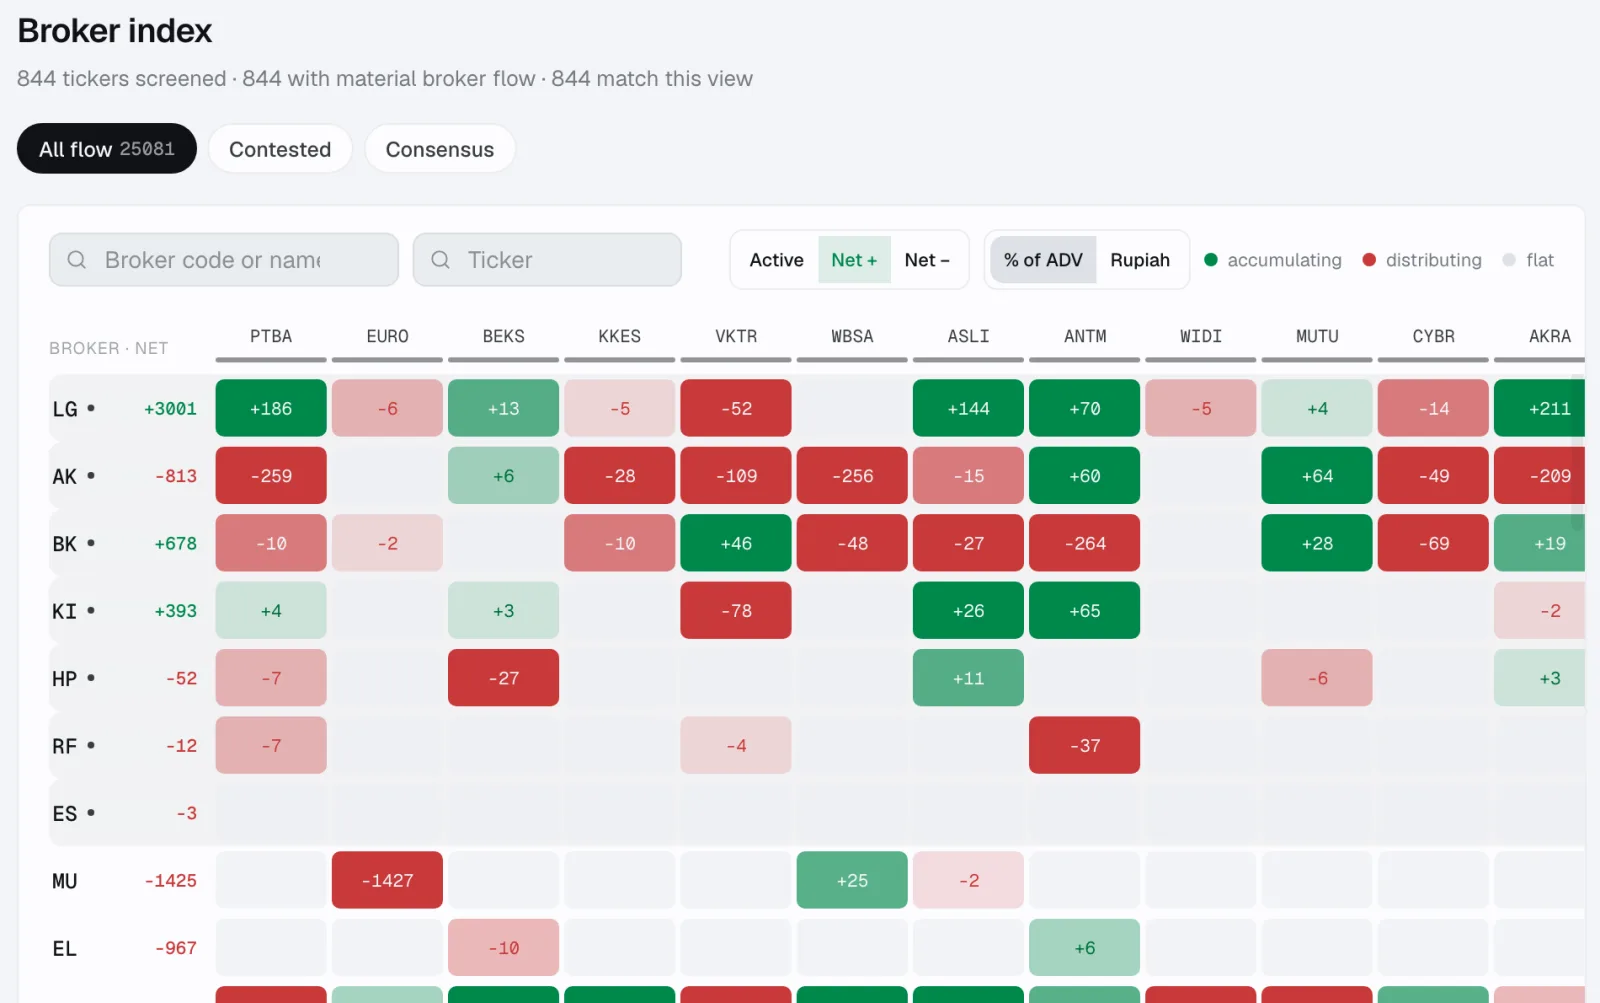
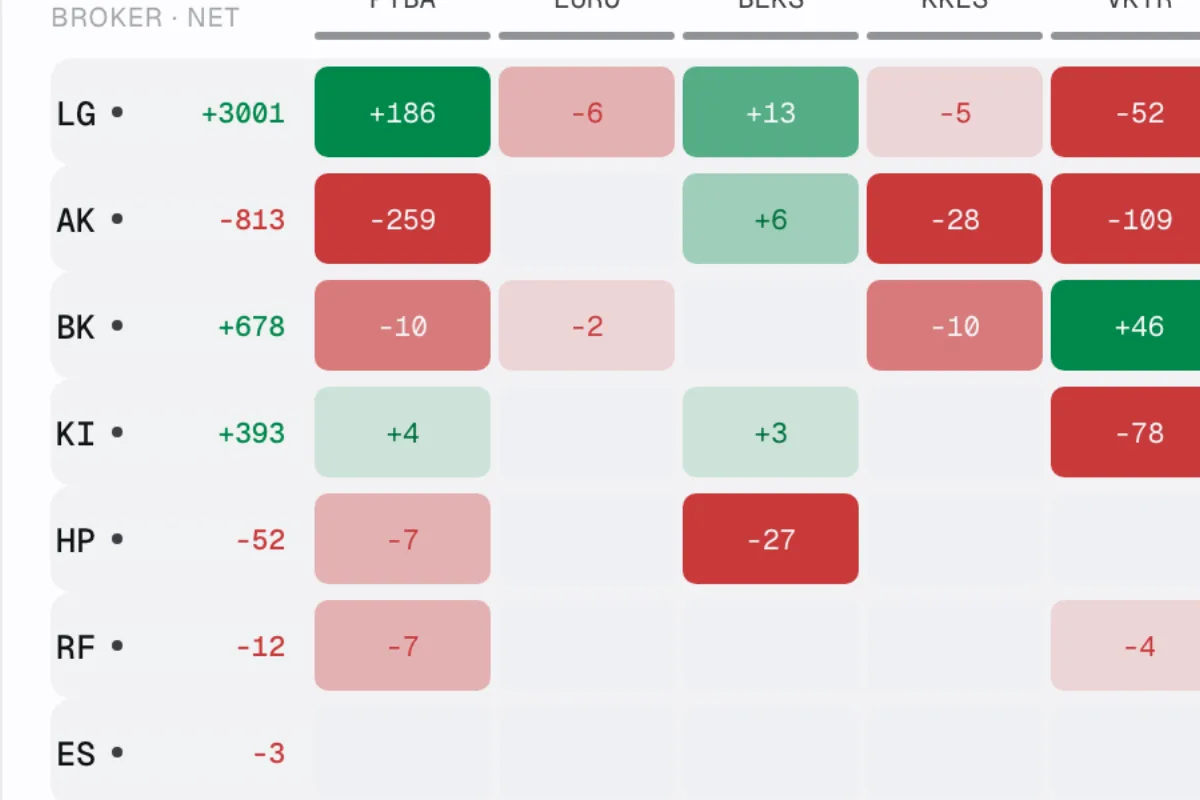
Broker heatmap
Brokers down the side, tickers across, net flow in each cell.
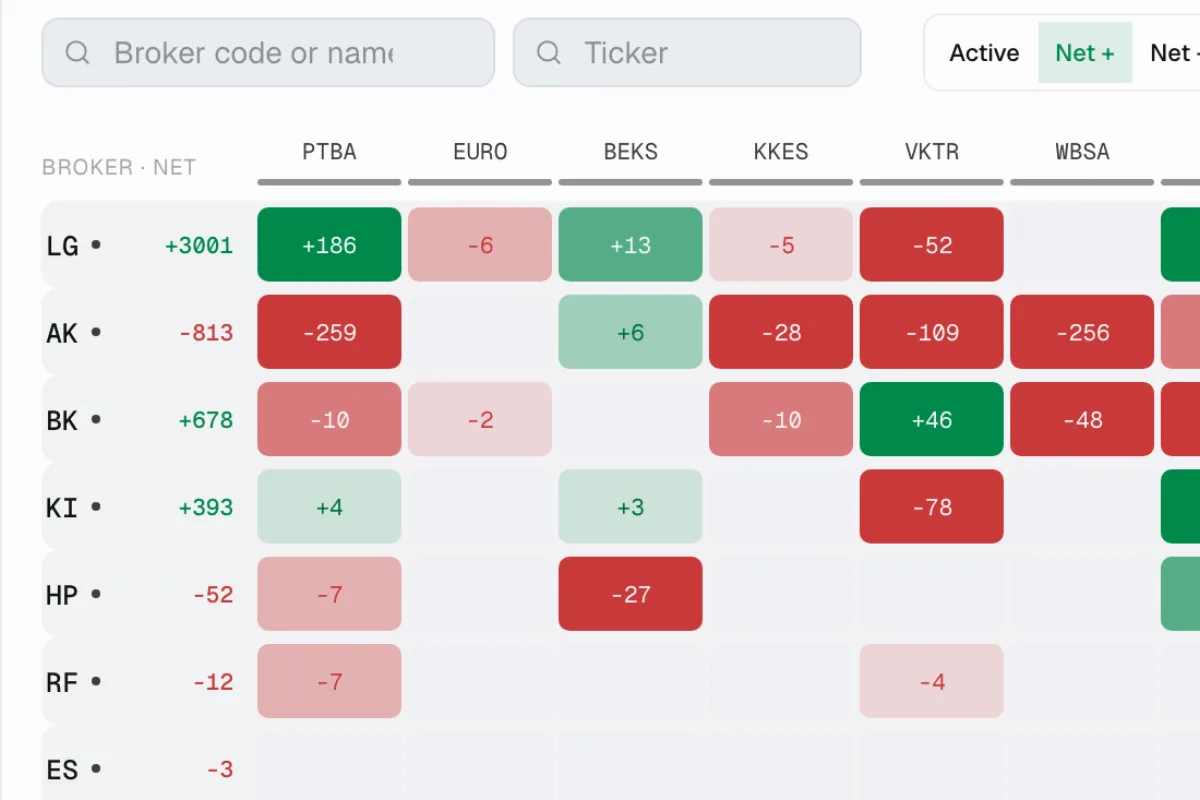
Window picker
Choose an accumulation window or custom dates, up to 366 days.
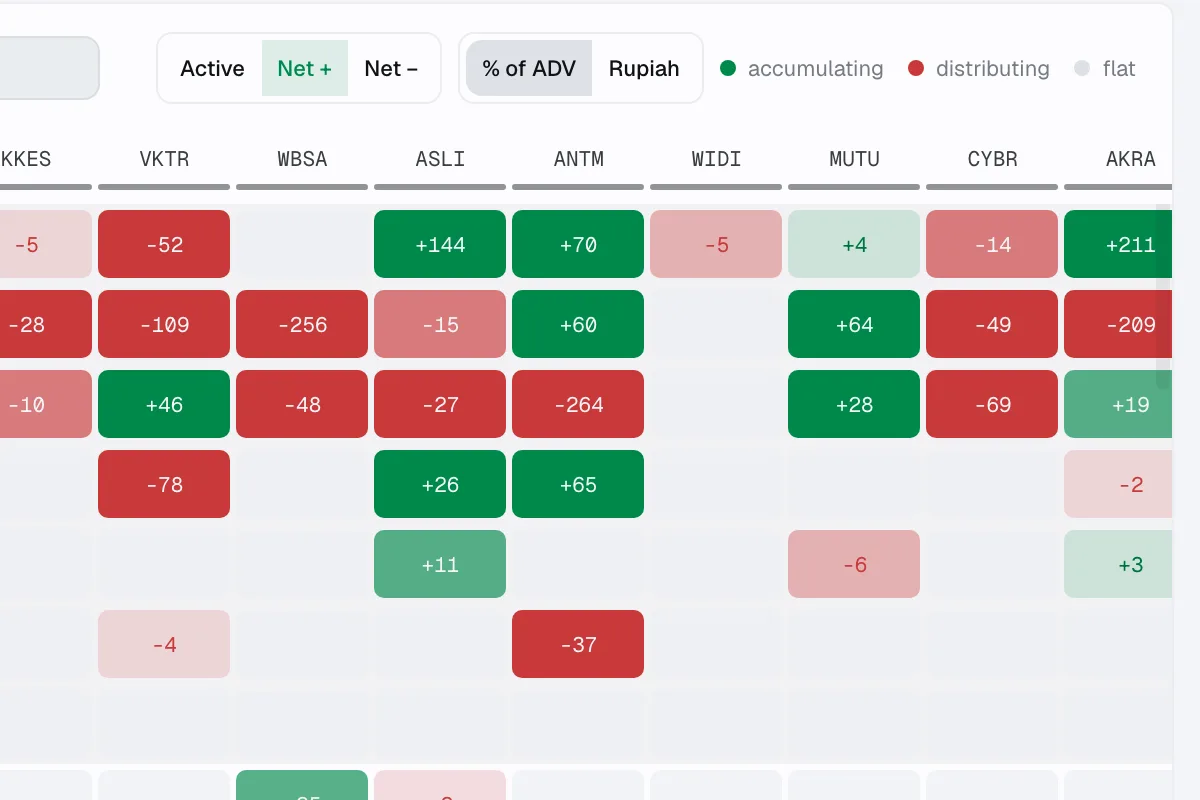
Rupiah or % of ADV
Switch the matrix between rupiah value and share of average volume.
Watched brokers
Follow brokers and see their combined net per ticker.
Broker leaderboard
Hit rate over 12 months from completed 20-session windows.
Estimated book
A broker's net positions, cost, last price and unrealised result.
Questions
01Is Brokers free?
Yes. Brokers is on the Free plan for every signed-in account.
02What does the heatmap show?
Each cell is a broker's net buying or selling in a ticker over the chosen window. Cells under 2% of average daily volume are left blank.
03Can I pick my own window?
Yes. Choose a preset window or custom dates. Dates are inclusive, so the same date twice shows a single day.
04What are watched brokers?
Brokers you follow. They get a marker in the matrix, and their combined net is shown for each ticker.
05How is a broker's hit rate calculated?
It counts completed accumulation windows from the last 12 months that ended higher after 20 sessions. Brokers below the sample floor are shown but not scored.