Which IDX Chart Tool Lets Me Mark My Own Price Levels?
Place a horizontal line on AKRA, read its actual price label and undo it. Three product screenshots separate a manual research annotation from a system signal.
By Trade Inc Research

Trade Inc’s Trading Chart lets you place your own horizontal price reference and undo it. We tested the workflow on AKRA’s daily chart through a Pro account on 10 October 2026: select Horizontal line, click inside the price pane, then use Undo to remove the drawing.
That is useful when you want to mark a level for further research without confusing it with the chart’s calculated overlays. It does not establish that the price is support, a target or a suitable order level. Trade Inc publishes this guide about its own product.
Key takeaways
- A manual horizontal line records the analyst’s chosen price, not a new AI finding.
- Check the line’s price label after clicking; visual placement is not precise price entry.
- Undo removed our test line while leaving the existing chart overlays in place.
1. Choose the stock and interval
Open Trading Chart, click the ticker selector, search for AKRA and choose AKR Corporindo. We used the 1D interval.
The example is an interface demonstration, not an AKRA valuation or technical recommendation. The chart showed a displayed price of 1,485 during our visit; we are not using that quote to calculate returns or validate the drawing.
Before adding anything, distinguish the existing red and green overlays from your own annotation. Otherwise, a screenshot can make an analyst-drawn line look like a system-generated conclusion.
2. Select Horizontal line
The drawing toolbar is on the left edge of the chart. Select Horizontal line, represented by a short horizontal stroke, then click the intended height in the price pane—not the volume panel.
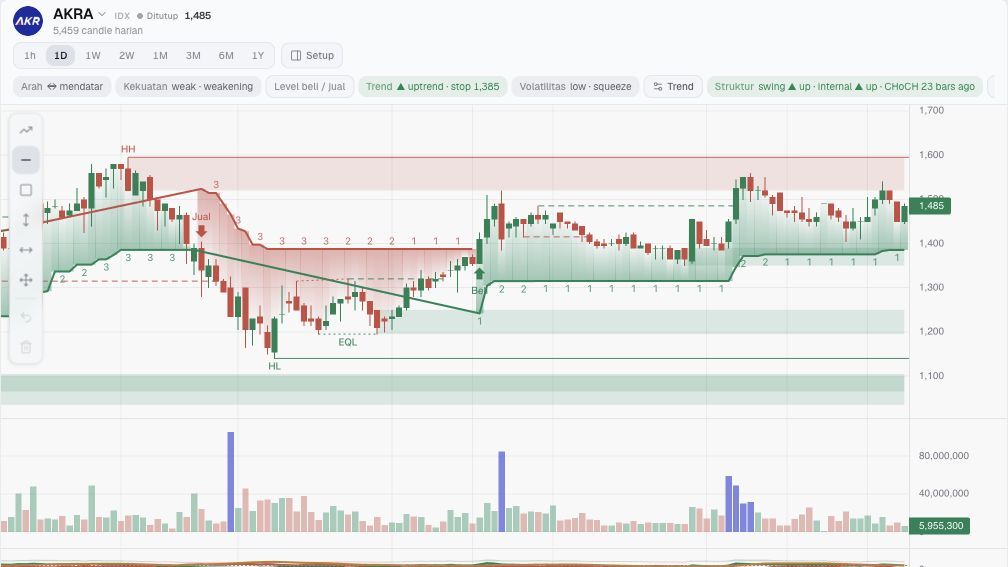
Before placement: the horizontal-stroke control is selected. The existing colored overlays were already present.
For a practical research note, choose a clearly defined question before drawing: for example, whether later daily closes remain above a previously identified price area. Record why you selected the area and which observations would invalidate the idea. A line by itself cannot provide that reasoning.
3. Read the result, not just the cursor
Our click near 1,400 produced a blue horizontal line with a displayed label of 1,401. The cursor readout beside it showed 1,401.138. Those are observed screen values, not a claim that this is a valid exchange order price.
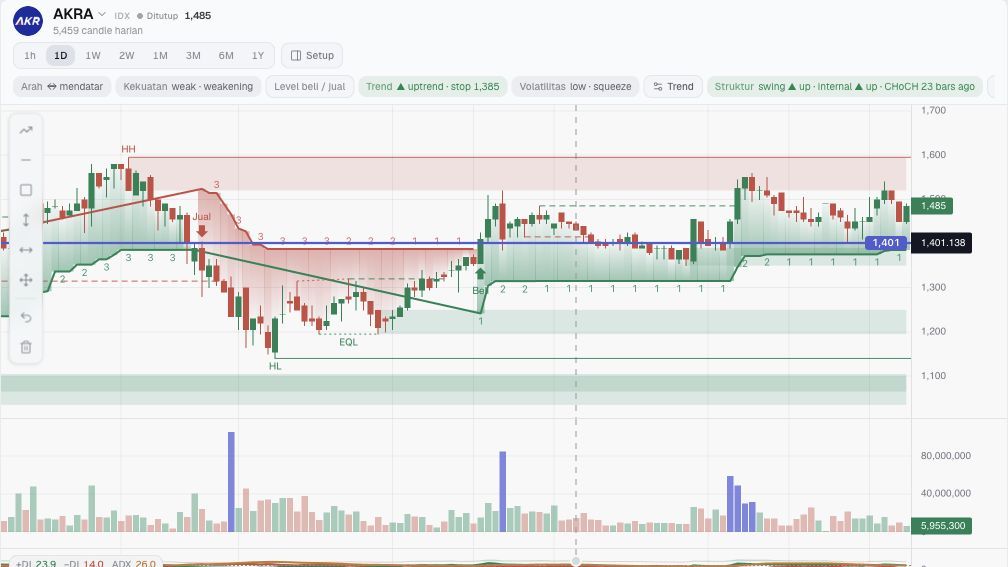
The blue line is our manual annotation. It was not generated as a buy signal or a support recommendation.
This small difference matters: “I clicked near 1,400” is not the same as “I entered exactly 1,400.” We did not verify numeric editing or snapping in this workflow. Do not copy a canvas coordinate into an order without separately checking the broker’s permitted price increments and order requirements.
4. Undo the test drawing
We pressed the curved-arrow control labeled Batalkan perubahan gambar terakhir in the Indonesian interface. The blue line disappeared, the earlier overlays remained, and Undo became disabled.
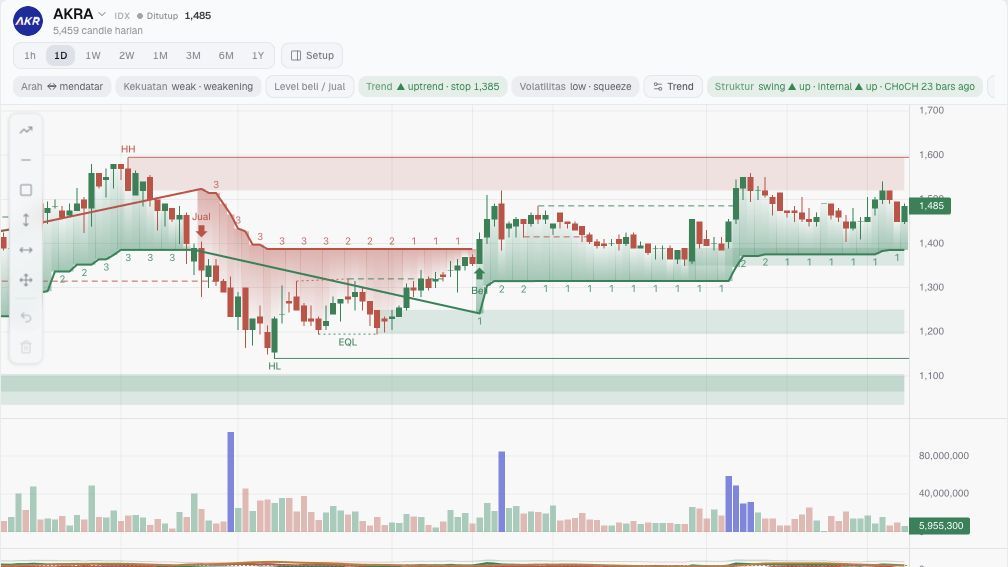
After Undo: the demonstration drawing is gone. No existing user drawing was removed.
Which tool fits this job?
Trade Inc fits someone already researching an IDX chart who wants a manual visual reference alongside its existing indicators. We tested a Pro account, not entitlement across every plan.
You may not need another tool if your existing charting platform already supports this. TradingView’s own horizontal-line documentation describes marking a price reference. Its additional editing and alert features should not be assumed to exist in Trade Inc; this demonstration verifies placement and Undo only.
For measuring a move rather than marking a level, see our price-and-date range walkthrough. For a calculated overlay rather than your own drawing, see the Trend stop explanation.
We did not test persistence after reload, cross-device syncing, alerts or order execution. The useful output is a clearly attributed research annotation—not evidence that a price will hold.
This article is for research and information only. It is not personalized financial advice or an instruction to trade.