Which IDX Chart Tool Explains Its Trend Stop Line?
Walk through INCO’s daily Trend panel: a 4,805 stop reference sits above a 4,270 close. See what that number explains—and why it is not an executed stop order.
By Trade Inc Research

Trade Inc’s Trading Chart is one option for IDX investors who want an explanation beside a trend stop line. Its Trend button opens a panel describing the line’s position and the current trend state. In our INCO daily-chart walkthrough, it showed a 4,805 reference above a 4,270 price—not an order we had placed, and not a guaranteed exit price.
That distinction matters when evaluating a charting tool. A number labelled “stop” can help interpret an indicator without telling you how much money a position can lose.
Key takeaways
- The INCO example uses 1D candles and the completed 9 October 2026 close of Rp4,270; the screen was inspected on 10 October 2026, around 14:05 WIB.
- The Trend panel displayed a downtrend, a stop reference of 4,805 and a distance of 12.5% above price.
- The walkthrough verifies the displayed explanation and distance arithmetic. It does not validate a trading strategy or the indicator’s historical accuracy.
- Opening this panel did not submit an order. Broker execution rules are a separate question.
How do you open the explanation?
Open Trading Chart, select INCO — Vale Indonesia Tbk., and choose 1D. Check the ticker and interval before interpreting the number: this example is not an hourly or weekly reading.
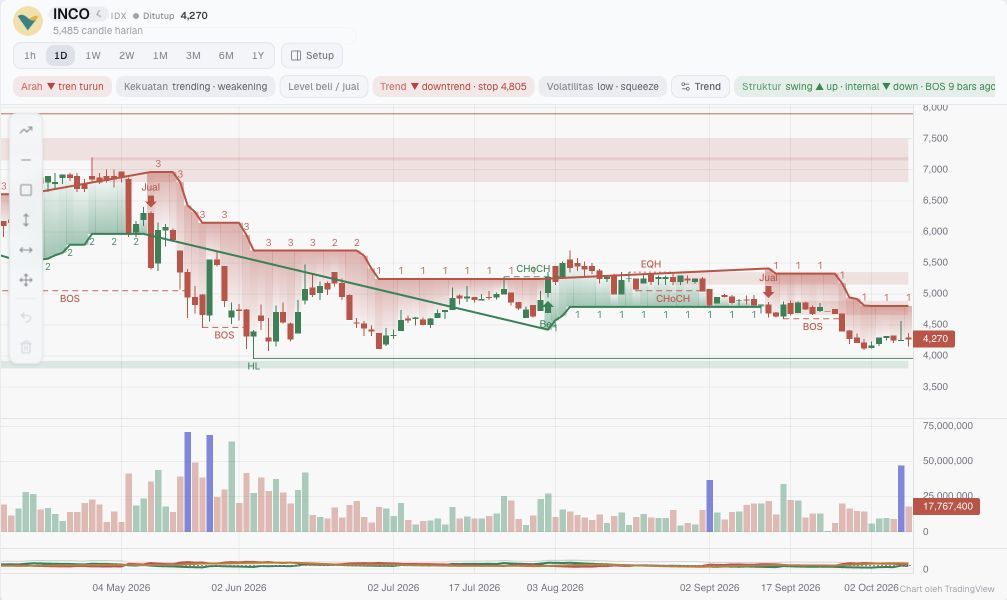
Step 1: the control we used is the red Trend button above the chart, showing “downtrend · stop 4,805”. Other overlays remain visible but are not evaluated here.
Click that Trend button—not the separate settings control. The explanation opens over the chart. In this capture, some explanatory text remains English within the Indonesian interface; the screenshot is the actual product, not a translated mock-up.
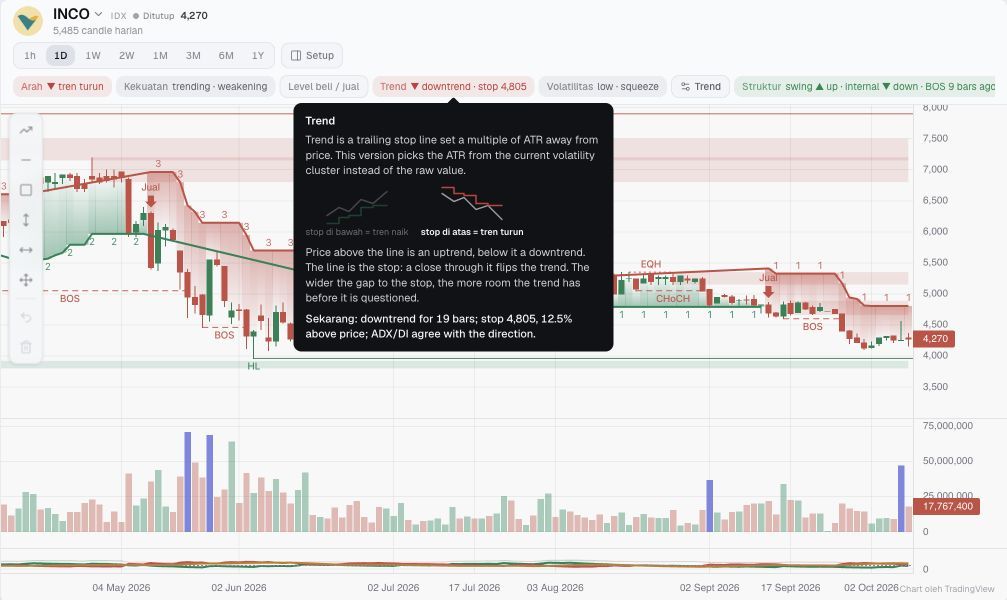
Step 2: the result is an explanation, not a trade confirmation. The panel reports 19 bars in the current state; we did not independently reconstruct that count.
What does 4,805 mean in this example?
The panel describes price above the line as an uptrend and price below it as a downtrend. It also describes a close through the line as a change of trend state. Those are the product’s stated interpretation rules, not a demonstrated future outcome.
| Item | Observed value | How to read it |
|---|---|---|
| INCO daily close | Rp4,270 | Completed 9 October candle |
| Trend stop reference | 4,805 | Above the displayed price |
| Difference | Rp535 | 4,805 minus 4,270 |
| Distance from price | About 12.5% | 535 ÷ 4,270 × 100 |
| Current state duration | 19 bars | Count reported by the panel |
We independently checked the subtraction and percentage: 12.529% rounds to 12.5%. The denominator is the displayed price, not the stop reference or an investor’s purchase price.
For someone holding INCO, a reference above the current price is not a statement that downside is limited to 12.5%. Nor is the distance a forecast that the stock will rise by that amount. This is a description of the indicator’s present configuration. A different interval or later candle can produce a different reading.
Is a chart stop the same as a broker stop order?
No. Our action opened explanatory text; it did not create or transmit an order. Before relying on any execution workflow, establish which order types your broker supports and what triggers them.
The SEC’s Investor.gov bulletin on stop orders explains that a stop trigger does not guarantee the eventual execution price, while a limit can prevent execution altogether. That is US investor education used to clarify trigger-versus-fill risk—not evidence that a particular order type is available on IDX or through an Indonesian broker.
Who is this feature useful for?
It fits a chart user who wants to inspect a trend reference and its explanation without leaving the chart. The useful buying criterion is whether you can identify the ticker, interval, state and reference—not how persuasive a coloured line looks.
You may not need it if you only require a basic price chart, focus on issuer financial statements, or already have a charting workflow that explains its indicators adequately. We observed this walkthrough in a Pro account; that observation does not establish availability under every plan.
What this walkthrough does not prove
We checked the current interface, matched Rp4,270 to the completed daily candle and reproduced the distance calculation. We did not independently recalculate the stop line, test historical state changes, measure win rates, or place orders. No new Screener or backtest was created.
The practical conclusion is narrow: Trade Inc exposes an explanation for this chart reference. Evaluate that clarity separately from strategy performance, position sizing and execution protection.
For related distinctions, read trend strength versus direction and order-book depth versus expected fill cost.
Publisher disclosure: this guide is produced by Trade Inc about its own product. INCO is a dated interface example, not a recommendation to buy or sell. Screenshots are original Trade Inc product captures.
This article is for research and information only. It is not personalized financial advice or an instruction to trade.