Which IDX Tool Helps Compare Operating Margins Without Mixing Definitions?
A real MYOR–ULTJ financial-view walkthrough shows why ULTJ’s 18.2% product margin and 19.2% filed operating margin differ—and reconciles the gap.
By Trade Inc Research

Trade Inc’s Fundamental view can help compare income-statement margins across IDX companies, but matching the year and denominator is only half the job. You must also match what each profit subtotal includes. Our FY2025 MYOR–ULTJ check reproduces the product’s operating rows—and shows why ULTJ’s 18.2% product margin differs from the 19.2% implied by its filed operating-profit subtotal.
This is a buyer guide with a two-company accounting comparison, not a stock ranking. Trade Inc publishes this guide about our own product. We tested the authenticated Pro workspace on 13 October 2026 around 08:30 WIB. The financial comparison deliberately uses the complete year ended 31 December 2025, not the current trailing-year summary.
Key takeaways
- Use Tahunan and % dari basis to compare annual income-statement rows as percentages of revenue.
- A common denominator does not make differently defined profit subtotals equivalent.
- ULTJ’s product operating row reconciles to gross profit less selling and administrative expenses. Its filing includes four additional income items before the operating subtotal.
- Neither the higher margin nor a successful reconciliation establishes the better investment.
Start with the same year and revenue base
Open MYOR’s company workspace, select Fundamental, and scroll to Laporan yang disampaikan. Click Tahunan (“Annual”), then % dari basis (“% of base”). Read the FY2025 column under Income statement — % dari total revenue.
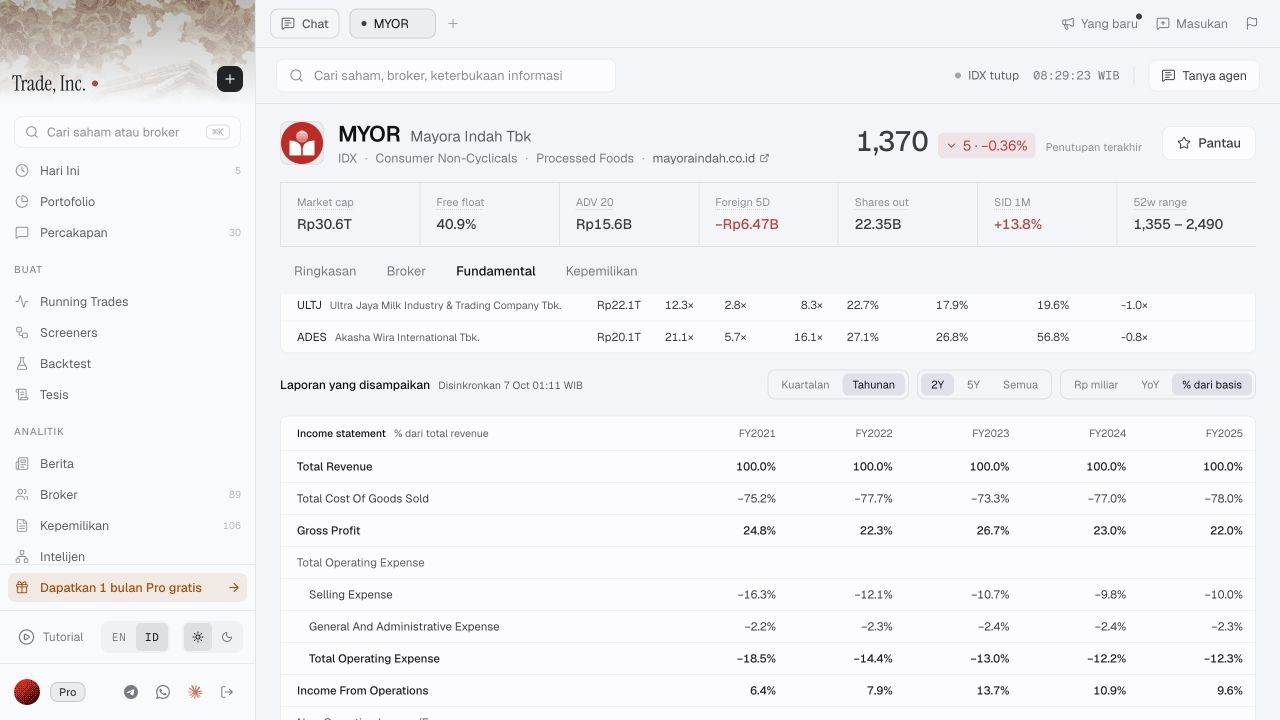
Step 1: the selected controls and table heading establish the comparison basis. Only the FY2025 statement rows discussed here were checked; prices, peer summaries and other years visible in the screenshot are outside this review.
Repeat those selections in ULTJ’s workspace. Do not compare a FY2025 table cell with the trailing-twelve-month overview higher on the page. The separate YoY control answers a growth question, not a margin question.
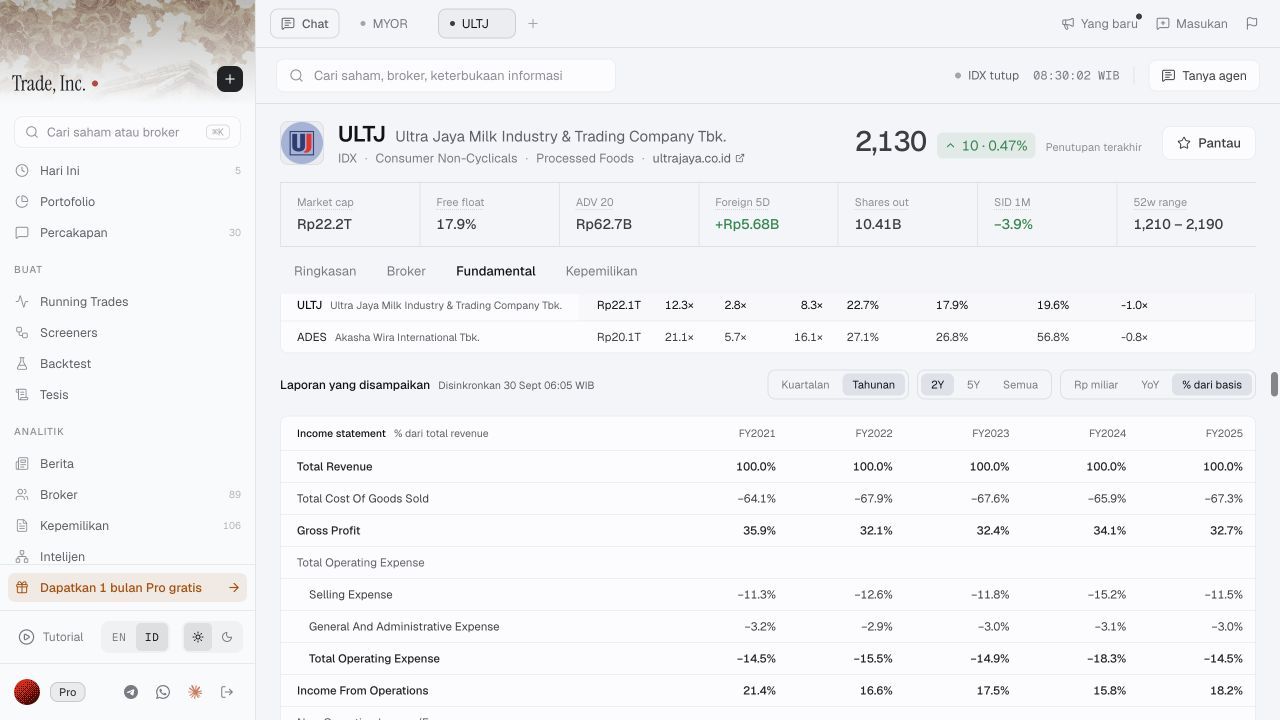
Step 2: ULTJ uses the same revenue denominator. The operating-row label still needs a source check.
Compare the operating rows, not just their labels
The following figures use gross profit minus selling and general/administrative expenses for both companies. Amounts are Rp billion; percentages are calculated from unrounded figures, then rounded to one decimal.
| FY2025 measure | MYOR | ULTJ |
|---|---|---|
| Revenue | 38,681.562 | 8,767.854 |
| Gross profit | 8,492.262 | 2,869.311 |
| Gross margin | 22.0% | 32.7% |
| Gross profit less selling and administrative expenses | 3,723.712 | 1,596.738 |
| That subtotal / revenue | 9.6% | 18.2% |
Sources: Mayora FY2025 financial statements, printed page 3, and Ultrajaya FY2025 financial statements, Exhibit B. These are two selected issuers, not a sector-wide sample.
The product’s rounded Income From Operations rows agree with this calculation. That gives a traceable comparison of these specified expense categories. It does not establish identical business models, revenue mix, cost classification or recurring earning power.
Reconcile ULTJ’s 18.2% with the filing’s 19.2%
Switch ULTJ back to Rp miliar. FY2025 displays operating income of approximately 1,597. The source calculation is 2,869.311 − 1,011.159 − 261.414 = 1,596.738.
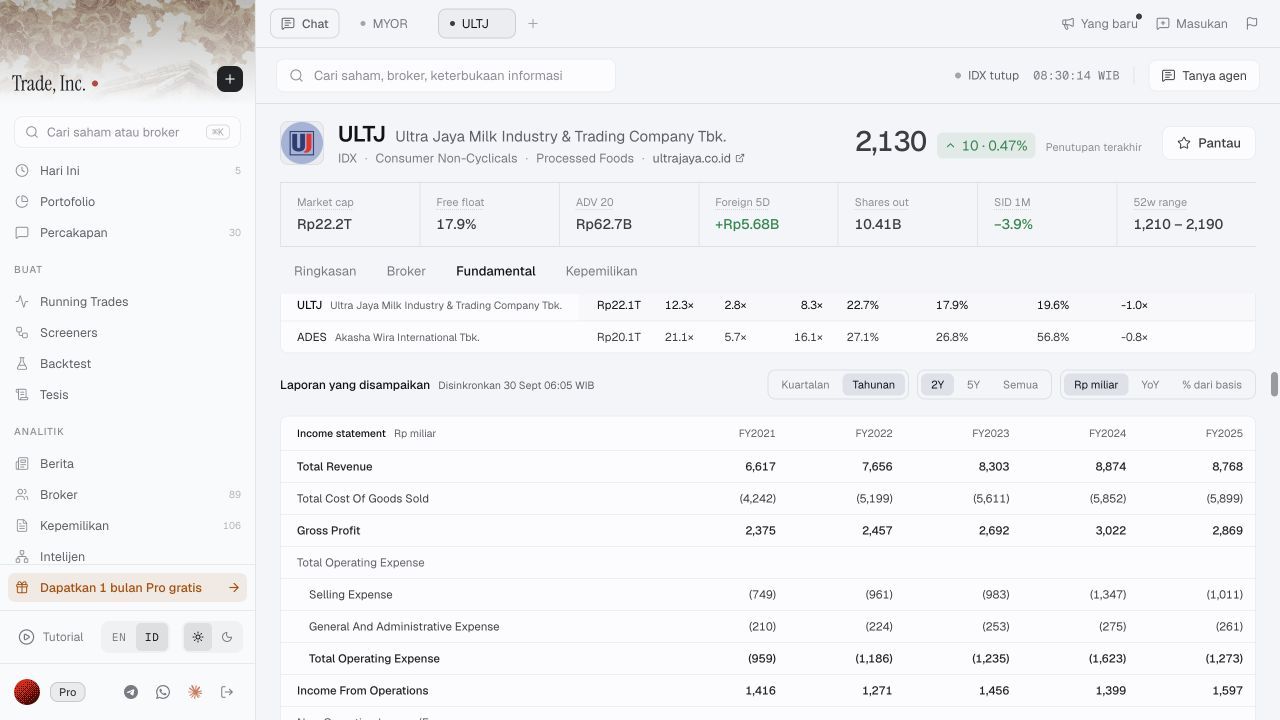
Step 3: return to amounts to reproduce the subtotal. Display rounding explains 1,597 versus 1,596.738; it does not explain the larger difference below.
Ultrajaya’s Exhibit B places four further items above its filed operating-profit subtotal: net foreign-exchange gain 77.931, fixed-asset disposal gain 0.727, livestock fair-value gain 1.742, and other net income 8.177, all Rp billion. Together they add 88.577, taking 1,596.738 to the filed 1,685.315.
Dividing each subtotal by the same revenue gives 18.21% and 19.22%: about 1.01 percentage points apart. This is a classification reconciliation for this example—not evidence that the filing is wrong, or that the product row is the filing’s exact subtotal. We did not verify a universal normalization policy across issuers.
Who needs this workflow—and who may not
This is useful if you compare companies repeatedly and want to move between amounts and margins without losing the period. The product supplies the views; the filing supplies the accounting context. Someone checking one company once may be better served by its original PDF and a calculator.
The public Trade Inc product page describes ticker financial statements and the Pro research workspace. This demonstration establishes what we observed in that signed-in workspace, not access on every plan or automatic reconciliation of every accounting label.
Before extending the comparison, define the profit measure, inspect items above and below it, and repeat across comparable periods. A changed classification, restatement or different consolidation scope would require rebuilding the comparison. No valuation, future-margin forecast or buy/sell conclusion follows from this table.
For the adjacent period problem, read quarterly versus annual statements. For another subtotal distinction, see group profit versus shareholders’ profit.
Methodology and limitations
Selected MYOR and ULTJ as two illustrative IDX food-and-beverage issuers, not a representative universe or ranked shortlist. Compare consolidated FY2025 income statements, year ended 31 December 2025, in IDR. Figures checked against issuer annual financial statements and the authenticated Trade Inc Pro Fundamental view on 13 October 2026 around 08:30 WIB. Use gross profit minus selling and general/administrative expenses for the matched subtotal; divide by revenue. For ULTJ reconcile that subtotal to filed profit from operations using the four identified other-income items. Convert issuer IDR/million amounts to Rp billion; calculate with unrounded source figures, display percentages rounded. Two issuers, one year; no missing value in the displayed comparison. No return test, execution assumptions, costs or performance benchmark apply. Differences in business mix, classifications and consolidation limit inference. No universal product-normalization policy, valuation, other screenshot data or future outcome validated.
This article is for research and information only. It is not personalized financial advice or an instruction to trade.