Which IDX Tool Separates Quarterly Revenue from Annual Results?
An ITMG walkthrough switches annual, quarterly and percentage views, reconciles Q4 revenue to issuer releases, and explains which financial fields this check does not validate.
By Trade Inc Research

Trade Inc’s issuer workspace lets you switch financial statements between annual and quarterly views, then show income-statement rows as a percentage of revenue. An ITMG check illustrates why these controls matter: US$2,304 million of FY2024 revenue is not Q4 revenue. Subtracting the issuer’s US$1,657 million nine-month figure gives approximately US$647 million for the fourth quarter—the number displayed in the quarterly table.
This guide is published by Trade Inc about our own product. We tested the signed-in Pro interface on 8 October 2026 around 14:00 WIB, using 2024 as a historical, source-checkable example. This is not a current earnings assessment or a recommendation on ITMG.
Key takeaways
- Match the period and currency before comparing numbers: a full year, nine months and one quarter are different measurement windows.
- For revenue, a fourth-quarter estimate can be checked as full-year revenue minus nine-month revenue, provided the reporting basis is consistent.
- A percentage-of-revenue view describes the composition of an income statement. It is not a year-on-year growth rate.
- A successful check of one revenue row does not validate every financial field or company in the product.
Start with the annual view and its unit
Open the ITMG issuer workspace, choose Fundamental, then scroll to Laporan yang disampaikan (“Filed statements”). Select Tahunan (“Annual”) and US$ jt (“US$ million”).
In our test, the FY2024 Total Revenue cell showed 2,304. The table’s unit matters: that is US$2,304 million, not rupiah and not US$2,304. Other years remain visible, but this walkthrough checks FY2024 only.

Step 1: select the period and unit before reading the row. Actual product screenshot; figures outside the stated example are not independently reviewed here.
The issuer’s FY2024 results release, dated 26 February 2025, reports revenue of US$2,304 million for the year ended 31 December 2024. This agrees with the annual cell at the displayed precision.
Switch to quarterly—and reconcile Q4
Click Kuartalan (“Quarterly”) while retaining US$ jt. The columns change to individual quarters. The Q4 2024 revenue cell shows 647, not 2,304.
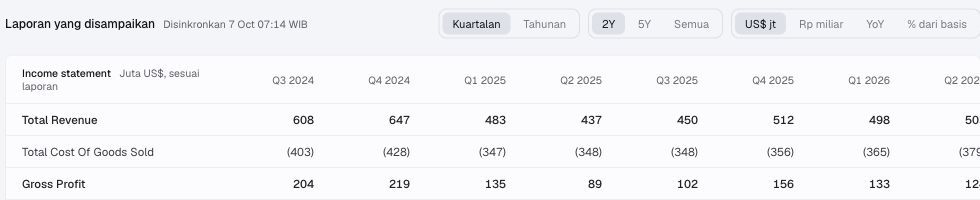
Step 2: the same revenue row now uses individual-quarter columns. The Q4 2024 cell is the target of this check.
ITMG’s nine-month release, dated 12 November 2024, reports revenue of US$1,657 million through 30 September 2024. Using the two releases’ rounded figures:
| Revenue period | US$ million |
|---|---|
| Full year 2024 | 2,304 |
| First nine months of 2024 | 1,657 |
| Implied Q4: full year minus nine months | 647 |
| Product Q4 2024 display | 647 |
This is a reconciliation at rounded-million precision, not an audit of the underlying data transformation. A restatement, classification change or different consolidation scope can break a simple subtraction; check those before interpreting any difference as an error.
Do not apply this subtraction indiscriminately to balance-sheet items. Revenue measures activity over a period; cash and debt balances describe a position at a date. Subtracting two cash balances gives a change in the balance, not “quarterly cash held”.
Read “% dari basis” as a denominator change
Return to Tahunan, then choose % dari basis (“% of base”). The income-statement heading changes to % dari total revenue. FY2024 revenue becomes 100.0%, while gross profit shows 30.3%.

Step 3: the heading identifies the denominator. This is a common-size income statement, not the separate YoY mode.
The annual amount view displayed gross profit of US$699 million. A check using displayed values gives 699 ÷ 2,304 × 100 ≈ 30.3%. Because displayed amounts are rounded, they need not reproduce every percentage to arbitrary decimal precision. The percentage describes gross profit relative to revenue, not a 30.3% increase in profit.
Fit, limits and the next check
This workflow is useful when you want to move from an annual overview to a specific quarter without losing the reporting unit, or compare income-statement composition across periods. Someone who only needs one official filing may prefer to read that document directly.
The screenshots are historical observations of an authenticated Pro session, not proof of access on every plan. We did not validate peer rankings, valuation, currency conversion, cash-flow rows or every year visible in the images. In particular, this revenue exercise does not resolve the separate quarter-end-cash presentation issue observed in the product. Do not extend this walkthrough’s validation to that field.
Before using another issuer or period, repeat the source check: select the unit, establish whether the figure is cumulative or discrete, and reconcile it to comparable filings. For broader tool-selection questions, read our financial-statement buyer guide. The useful outcome is a traceable number—not confidence based on the interface alone.
This article is for research and information only. It is not personalized financial advice or an instruction to trade.