Which IDX Chart Tool Separates Trend Strength from Direction?
An ADRO chart walkthrough shows why +DI can lead while the trend label stays sideways. Open the strength and direction panels, then interpret what each actually says.
By Trade Inc Research

Trade Inc’s Trading Chart provides separate Kekuatan (strength) and Arah (direction) controls for IDX stocks. Open both instead of treating an upward price move—or a positive directional reading—as proof of a strong uptrend.
In our ADRO daily-chart demonstration, the interface displayed ADX 17.2, +DI 20.9 and −DI 19.2. Although +DI was higher, Arah still read mendatar, or sideways. That is the practical reason to inspect strength and direction separately.
This is a product walkthrough captured on 7 October 2026, around 14:02 WIB, with the chart labelled Live. The figures are a UI snapshot, not verified closing-session values or a recommendation on ADRO. Trade Inc publishes this guide about its own product.
Key takeaways
- Open Kekuatan to inspect the ADX reading, then Arah to see how the interface describes direction.
- A higher +DI than −DI does not, by itself, establish a strong upward trend.
- ADX is an indicator reading—not a probability, expected return or valuation measure.
- Keep the ticker and candle interval unchanged when comparing the two panels.
What should an IDX chart tool make clear?
A useful chart workflow answers two different questions: which direction is being indicated, and how persistent is the trend?
Fidelity’s technical guide describes ADX as a measure of trend strength in either direction; +DI and −DI belong to the directional-movement system. It describes readings below 20 as typically associated with a trendless market and above 25 with a strong trend. These are interpretive conventions, not guarantees. Fidelity: DMI
Do not assume every platform uses identical labels or boundaries. Read the explanation attached to the actual chart you are using.
Step 1: select the stock and interval
Open Grafik Trading, click the ticker name, search for ADRO, and select the matching company. Select 1D for daily candles. In our session, the chart displayed 4,416 daily candles.
The screenshots use the Indonesian interface. The controls discussed here are Kekuatan and Arah, immediately above the chart. They are clickable explanations, not merely static badges.
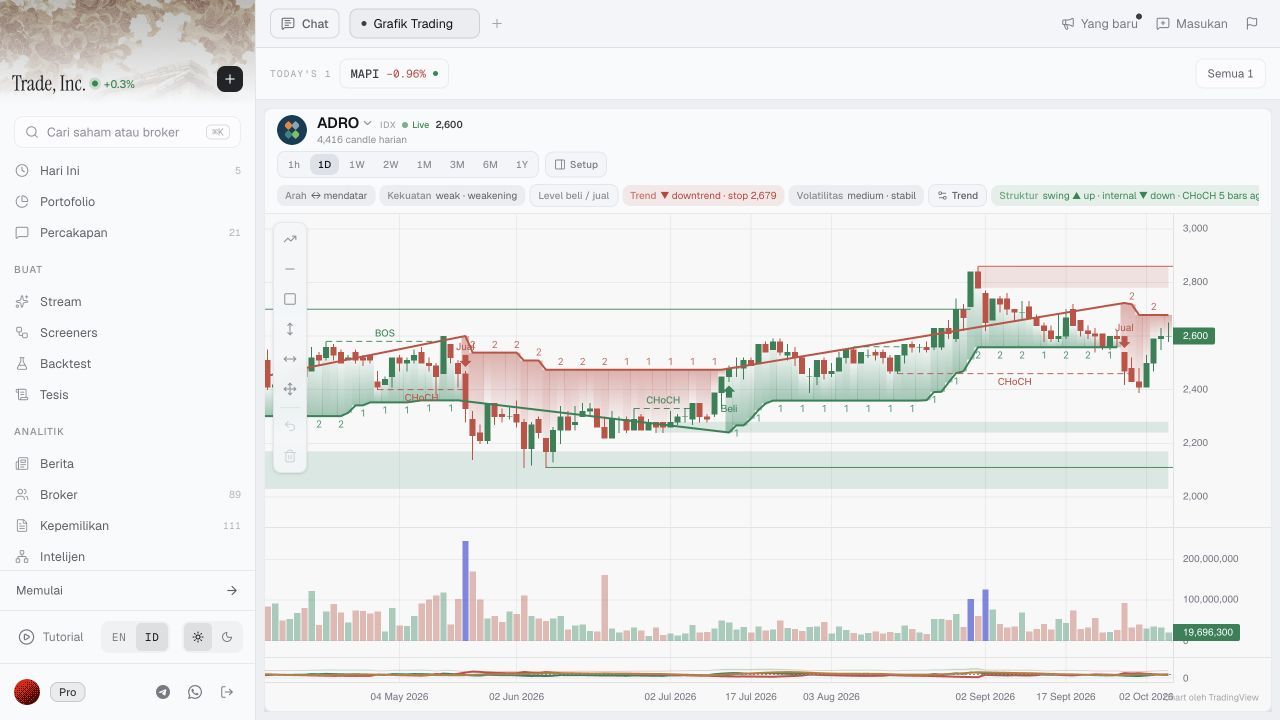
Before clicking: ADRO and 1D are selected. Start with the two controls above the chart, not with a Buy or Sell label elsewhere on the screen.
This demonstration was made in a Pro-labelled account. It verifies that workflow in that session; it does not establish which other plans include it.
Step 2: click Kekuatan and read the strength result
Click Kekuatan weak · weakening. The opened panel identifies the indicator as ADX and displays the current reading.
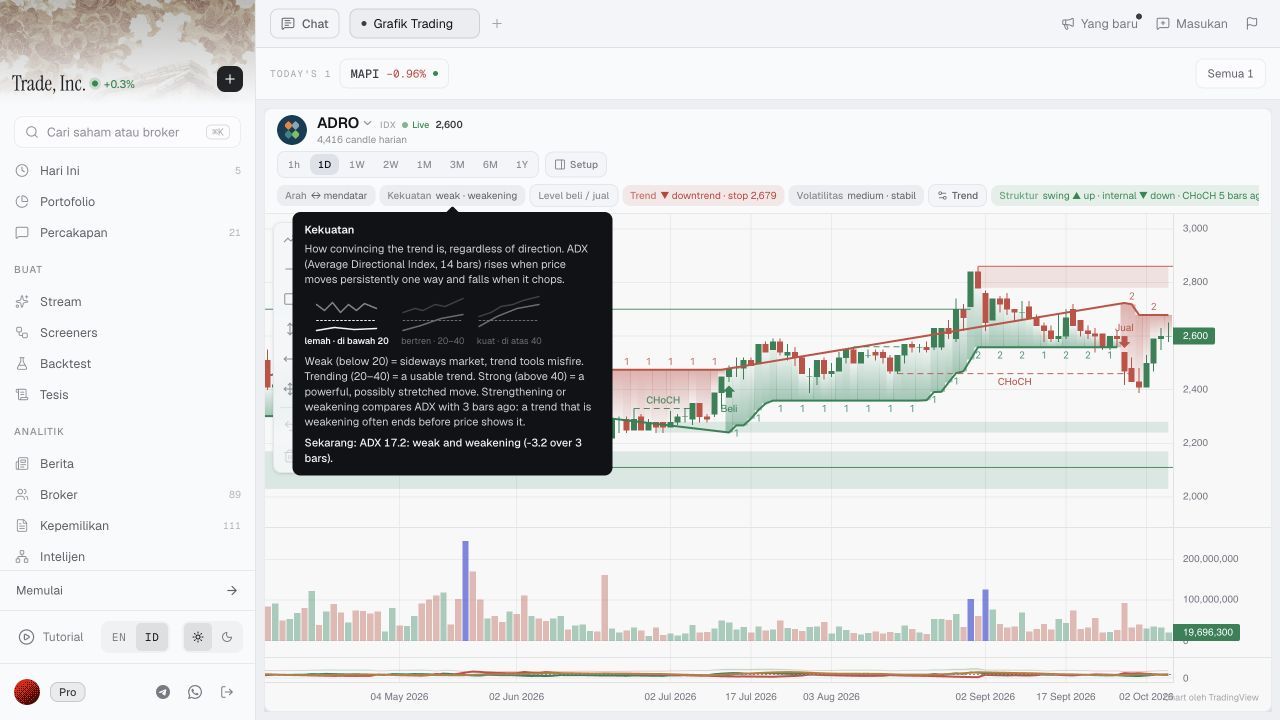
After clicking Kekuatan: the panel shows ADX 17.2 and labels the reading weak and weakening.
The result answers a strength question. It does not say that ADRO must fall, that a reversal is imminent, or that a breakout cannot occur. In particular, 17.2 is not a 17.2% probability of anything.
The panel includes broader interpretive language about trend behaviour. This walkthrough verifies the displayed controls and numbers, not predictive claims. We did not independently recompute the indicator or test whether these labels improve trading outcomes.
Step 3: click Arah and compare the explanation
Next, click Arah ↔ mendatar.
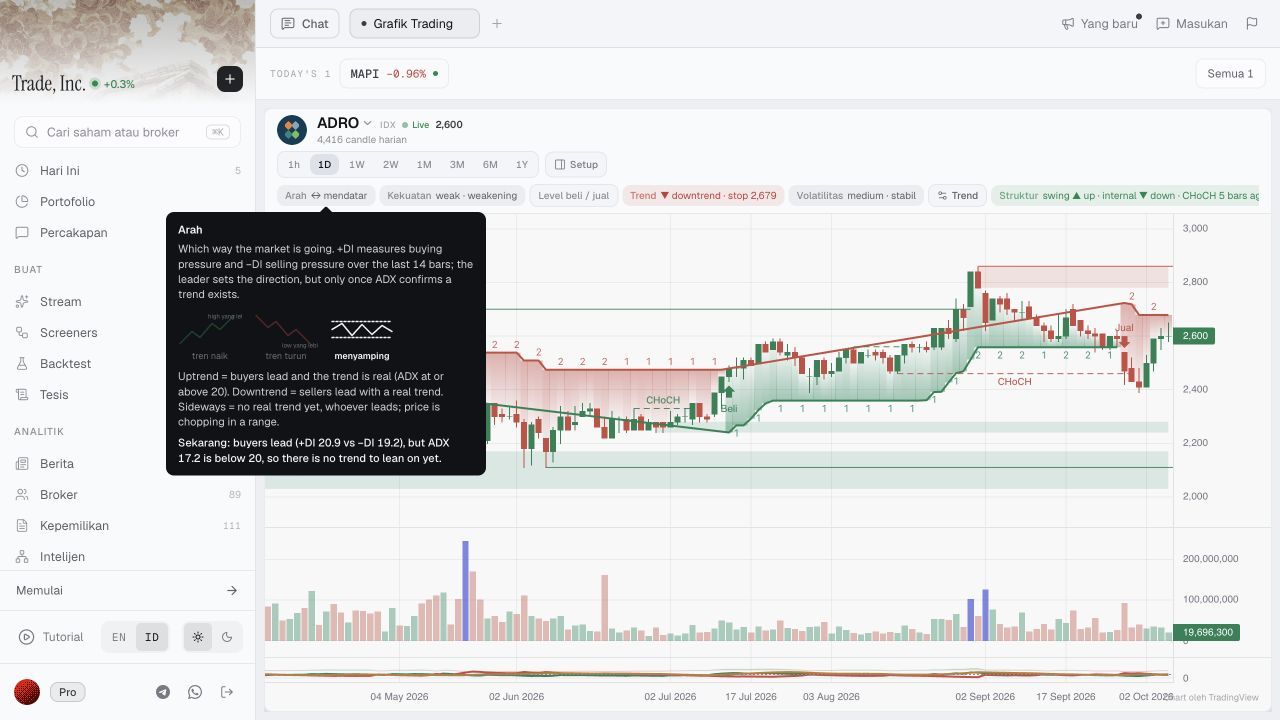
After clicking Arah: +DI exceeds −DI, but the panel still explains the direction label as sideways because the displayed ADX is below its stated threshold.
The distinction is visible in the actual result:
| Displayed item | ADRO snapshot | What the reader can conclude |
|---|---|---|
| ADX | 17.2 | The panel classifies trend strength as weak |
| +DI versus −DI | 20.9 versus 19.2 | The positive directional component is higher |
| Arah label | Sideways | A positive component lead is not enough for this interface’s uptrend label |
The panel uses “buyers lead” as shorthand. Do not read that wording as evidence identifying actual buyers, institutional accumulation, broker transactions or beneficial owners. This is a chart-indicator explanation, not an ownership report.
How to use the result without overstating it
Suppose your initial research note says: “The latest candles moved higher, so this is a strong uptrend.” This walkthrough gives you a specific cross-check: open strength before keeping the word strong.
For the captured ADRO example, a more defensible note is: “The positive directional component leads, but the interface’s strength reading remains weak and its direction label is sideways.” That statement preserves what the tool actually showed without predicting the next move.
Other overlays on the chart may describe different aspects of price behaviour. Do not combine every green badge into one bullish vote, or assume different labels must share the same meaning. For a separate question—how two stocks performed over the same dates—use a same-starting-basis comparison, not an ADX reading.
Who this workflow fits—and who may not need it
This is useful for readers already reviewing individual IDX charts who want the explanation behind a trend label. It helps distinguish an indicator’s direction from its strength without leaving the chart.
It is not an all-IDX pattern scan, a double-bottom detector demonstrated across a universe, a backtest, or a company valuation. If you only need financial statements or a simple historical price chart, this particular workflow may add little. It also does not replace checking liquidity, disclosures and the time horizon of your research.
Limits and conclusion
The screenshots document one stock, one selected interval and one live interface session. We did not audit historical price adjustments, recompute ADX from candles, verify a completed-session cutoff, or measure predictive accuracy. Changing the interval or returning later may produce different readings.
A useful follow-up is to revisit the same ticker and interval and record whether the displayed strength and directional components agree more clearly or remain mixed. A later stronger reading would support a different description of the indicator state; it would still not guarantee a profitable trade.
Use Trade Inc’s Kekuatan and Arah panels together to understand the labels, not to turn one number into a trading promise. The ADRO example shows why: a positive directional lead and a strong uptrend are not interchangeable conclusions.
This article is for research and information only. It is not personalized financial advice or an instruction to trade.