Which AI Tool Can Compare IDX Stock Performance on the Same Starting Basis?
An actual ICBP–INDF chat demonstration shows how to rebase prices to 100, verify the endpoints and distinguish a smaller price decline from a positive investment return.
By Trade Inc Research

Summary
Trade Inc chat can put two IDX stocks on the same starting-price basis and show the prices behind the comparison. In our authenticated product test on 7 October 2026, it correctly compared ICBP and INDF from the 1 September close to the 6 October close, without using the current intraday quote.
The result was not a winning-stock recommendation: both stored prices fell. INDF declined 4.86%, versus 7.80% for ICBP—a 2.94-percentage-point difference. This is a comparison of stored closing prices, not verified total shareholder returns; corporate-action adjustment status was unknown.
Key takeaways
- Set identical start and end dates and ask for the actual endpoint prices before accepting a ranking.
- Rebase each starting price to 100 to compare proportional movement, not rupiah price levels.
- A higher ending index can mean a smaller loss, not a gain.
- This demonstration used a signed-in Pro account. It does not establish availability on every plan or a guaranteed result from every prompt.
Step 1: ask chat for a bounded comparison
Open Percakapan / Chat, enter the tickers and completed-session dates, and press the upward-arrow send button. We entered this request in the normal chat interface, not a standalone free calculator:
Compare ICBP and INDF using completed daily closing prices on 1 September and 6 October 2026. Retrieve the four actual endpoint prices. Rebase each stock to 100 at the 1 September close. Calculate each price change and the difference in percentage points. State whether corporate-action adjustment is known. Do not use today's intraday prices or run a backtest.
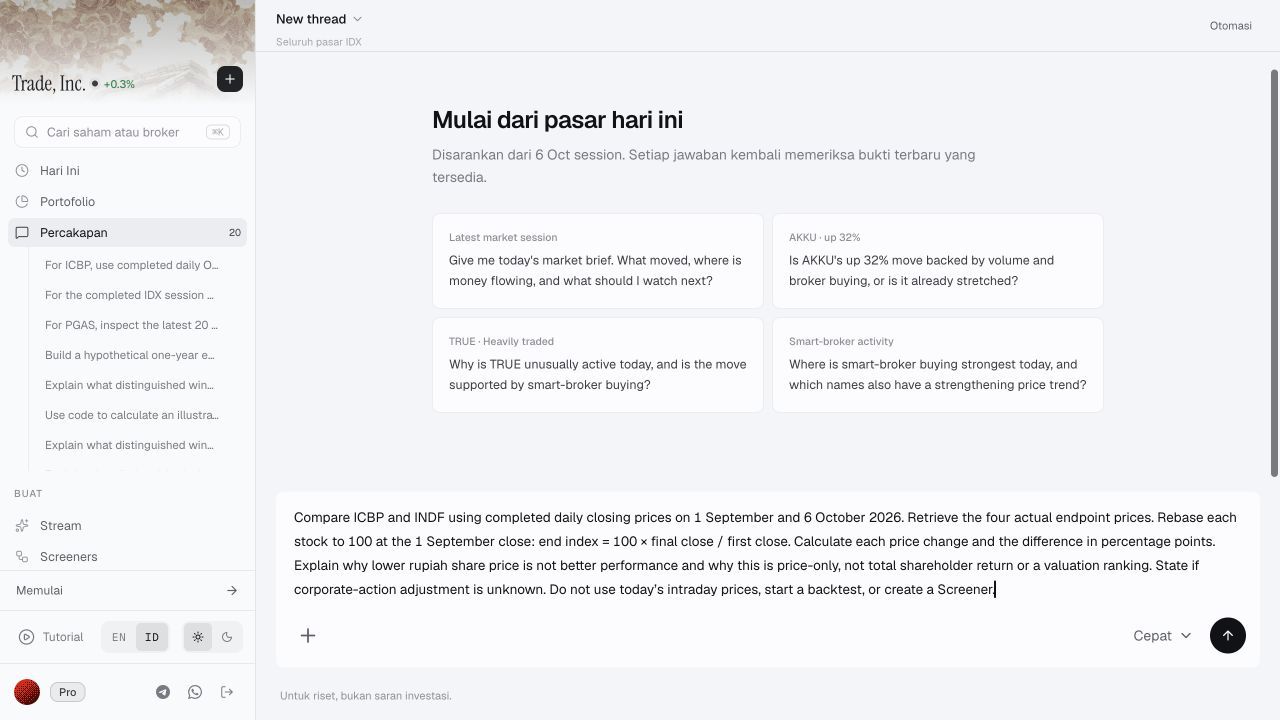
Actual input screen. The lower-right upward arrow sends the request. The market suggestion cards are not inputs to this comparison.
These constraints matter: comparing one stock's latest live quote with another stock's completed close creates a different question. Starting at the 1 September close also excludes that day's open-to-close movement.
Step 2: inspect the returned prices, not just the verdict
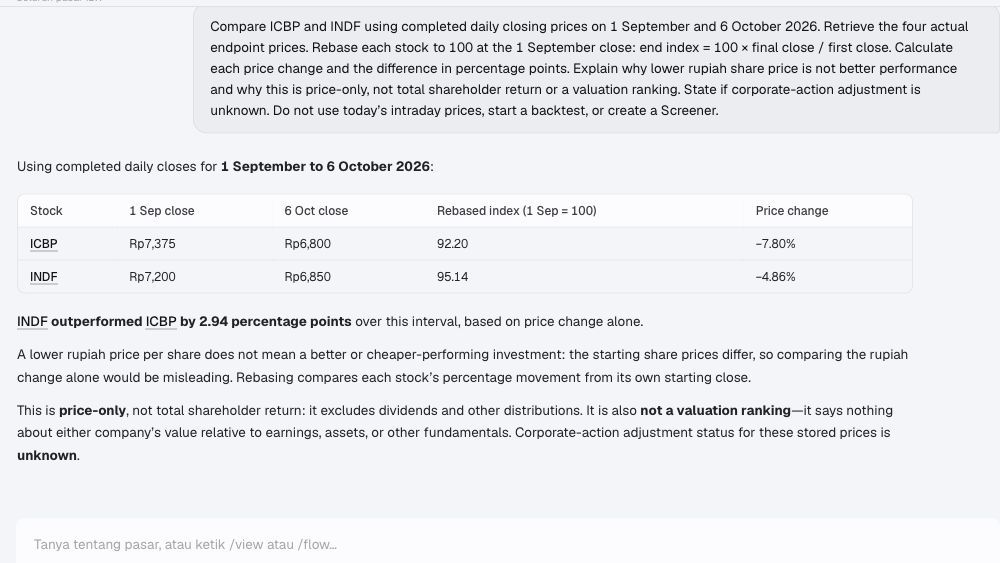
Actual response, cropped to the research conversation. No values were drawn into the screenshot.
| Stock | 1 Sep 2026 close, Rp/share | 6 Oct 2026 close, Rp/share | Ending index, start = 100 | Stored-price change |
|---|---|---|---|---|
| ICBP | 7,375 | 6,800 | 92.20 | −7.80% |
| INDF | 7,200 | 6,850 | 95.14 | −4.86% |
Source: Trade Inc completed daily-price retrieval and actual chat demonstration; all four endpoints were cross-checked against a separate read-only retrieval. That checks consistency within the product, not independent exchange certification.
ICBP ended at the lower rupiah share price, yet fell more over this window. The nominal price of one share does not measure performance or valuation.
Step 3: reproduce the comparison
Use two short calculations:
- Ending index = 100 × ending close ÷ starting close.
- Price change = ending index − 100, expressed as a percentage.
For ICBP, 100 × 6,800 ÷ 7,375 = 92.2034, or −7.7966%. For INDF, 100 × 6,850 ÷ 7,200 = 95.1389, or −4.8611%. Subtracting the unrounded changes gives 2.9355 percentage points in INDF's favour, rounded to 2.94.
This difference is not a 2.94% profit. Nor does it tell us which stock was less volatile between the endpoints. A two-date comparison cannot reveal the path, maximum drawdown or correlation; those require additional observations.
Who this workflow fits—and who may not need it
Chat is useful when a researcher wants a transparent comparison with explicit dates, denominators and follow-up explanations in one conversation. It is especially helpful for catching an ambiguous request such as “which stock did better?”
If you already have reliable, consistently adjusted endpoint prices, a spreadsheet can perform this calculation just as directly. This demonstration is not evidence that an AI subscription is necessary for simple arithmetic. It also does not establish a market-wide ranking, a saved comparison chart or automated monitoring.
Limits that can change the conclusion
We did not establish whether the stored series was adjusted for corporate actions. Verify that basis before interpreting the figures as economically comparable investment performance, especially across a split or other capital event. We did not audit corporate events or cash distributions for this pair.
No dividends, fees, taxes or investor-specific transactions were added. Vanguard's performance guide explains that total return includes both changes in value and investment income; it also distinguishes reported investment performance from an investor's own outcome.
The selected dates are a worked example, not an optimized window. Different dates, corrected prices or an appropriate total-return series could change the comparison. No strategy, entry rule, execution assumption or backtest was evaluated.
Conclusion: make the comparison inspectable
Choose a tool that returns the dates and prices needed to reproduce its answer. Trade Inc passed that narrow test here. Before turning a relative-price observation into an investment decision, confirm adjustments and distributions, inspect the intervening path, and research the businesses separately.
Publisher disclosure: this guide is produced by Trade Inc Research about Trade Inc's own product. The screenshots document one authenticated test, not an independent product ranking or investment recommendation.
Related reading
- Compare how two stocks move together, rather than which endpoint fell less
- Check the difference between a stock split and a cheaper valuation
This article is for research and information only. It is not personalized financial advice or an instruction to trade.