What Tool Can Mark BOS and CHoCH on IDX Stock Charts?
An ERAA walkthrough shows the SMC controls, swing-point labels and structure explanation—and why a historical chart annotation is not a trade signal.
By Trade Inc Research

Trade Inc’s Trading Chart can display BOS and CHoCH market-structure annotations on IDX stocks, alongside swing-point labels and separate swing and internal direction summaries. In an actual ERAA daily-chart walkthrough, we opened the SMC settings, enabled swing-point labels and inspected the resulting chart and its explanation.
The useful question is not whether a green label means “buy.” It is which price structure the chart is describing, on which interval, and what evidence would contradict that reading. This walkthrough shows the interface, not a validated trading strategy.
Key takeaways
- Open an IDX ticker in Trading Chart, choose an interval, then use SMC to control the market-structure overlay.
- BOS means break of structure; CHoCH means change of character. The product uses them to distinguish continuation through a prior swing from a break against the preceding direction.
- Swing and internal structure describe different scales of price movement. Neither identifies the investors behind a trade.
- Historical labels are not proof that the same information was available at the marked candle in real time.
Start with one ticker and one interval
Open ERAA in Trading Chart and select 1D. In the Indonesian interface used here, the navigation item is Grafik Trading. Keeping the ticker and interval fixed makes it possible to see what a setting changes without also changing the underlying question.
Click SMC, the settings button beside the Struktur summary. Leave the main overlay enabled. Our capture used Historis mode, with swing and internal structure enabled. The switch Titik swing HH / HL / LH / LL was initially off; that is the control we changed.
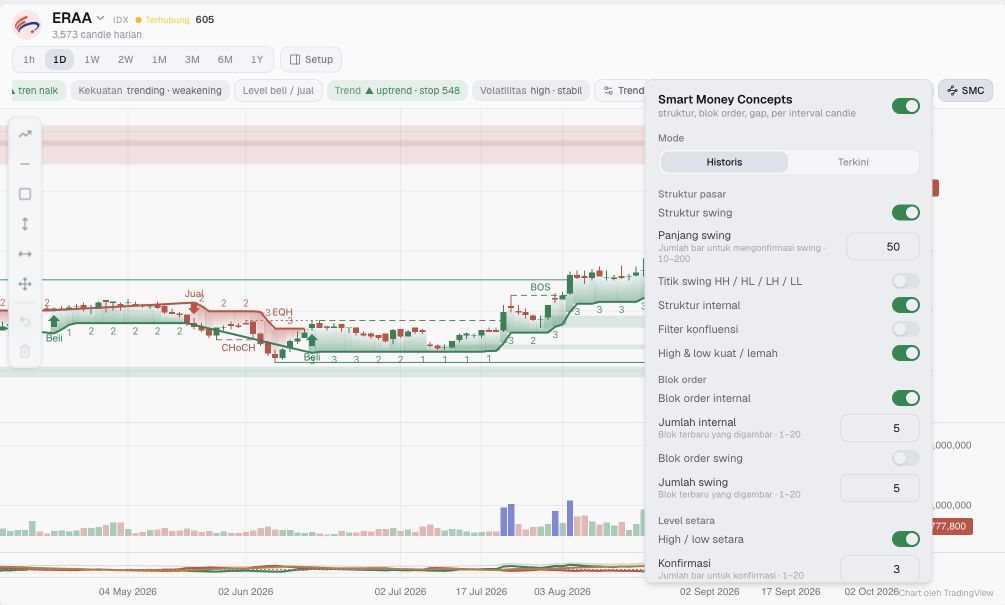
Step 1 — Open SMC and locate the swing-point label switch. This is an actual product screenshot, not a mock-up.
Turn on the labels, then read the chart
Enable Titik swing HH / HL / LH / LL, then close the settings panel. The ERAA result contains an LL marker near the June trough, a CHoCH annotation earlier in the visible decline and a BOS annotation around the later advance. These are the labels rendered by the product; we are not independently certifying their detection dates or trading value.
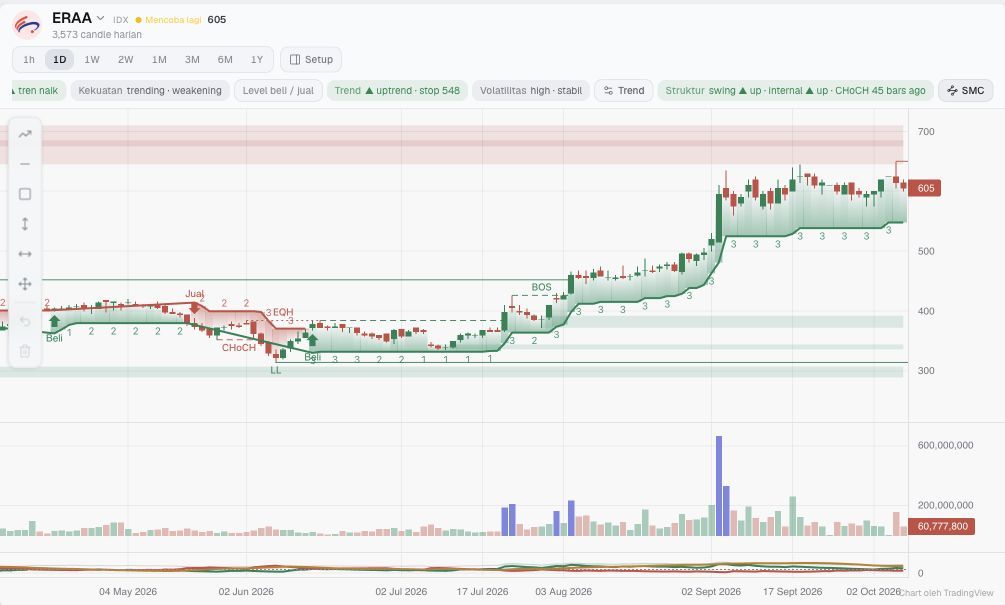
Step 2 — The result adds swing-point context to the existing structure overlay. Other indicators remain visible; their buy/sell wording is not a recommendation from this article. The captured connection indicator says it is retrying, so the image is not evidence of an uninterrupted live feed.
The four swing abbreviations are relative comparisons: HH is a higher high, HL a higher low, LH a lower high and LL a lower low. A low is compared with another relevant low, not with the immediately preceding high. Fidelity’s explanation of trend describes rising peaks and troughs as an uptrend, and falling peaks and troughs as a downtrend. That general concept does not validate any particular software’s labels.
Open the explanation instead of guessing from the colour
Click the Struktur summary. In this capture it reported swing bullish, internal bullish, and the last swing bullish CHoCH 45 bars ago. That is a displayed historical classification, not a forecast or a claim of a fresh signal today. On a daily chart, bars should not be silently converted into calendar days.
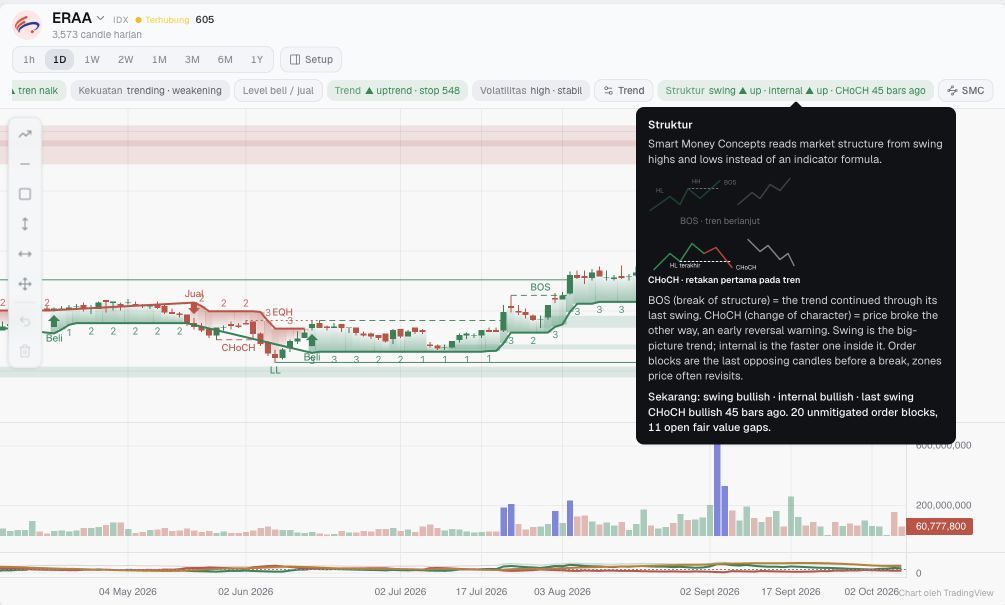
Step 3 — Read the structure summary and explanation together. The bullish CHoCH in the summary need not be the earlier, opposite-direction CHoCH label visible elsewhere in the chart.
The product explains swing as the broader structure and internal as the faster structure within it. If they disagree on another chart, record the disagreement rather than treating the faster move as automatic confirmation that the broader trend has reversed. A continuation reading would become more convincing if subsequent completed bars preserved the relevant swing structure; a break against it would weaken that interpretation. Neither observation supplies an execution price or a probability of profit.
What this walkthrough does not establish
“Smart Money Concepts” is the feature’s name, not evidence of institutional ownership, buying intent or hidden orders. This test did not audit the detection algorithm, pivot-confirmation timing, repainting behaviour or performance after a label appeared. The settings themselves describe swing confirmation using a number of bars; a retrospective marker must therefore not be assumed to have been immediately actionable at the turning point.
We checked the interface during the afternoon session on 8 October 2026 (WIB), in an authenticated Pro account. This confirms the workflow in that account, not entitlement across all plans. The separate completed-candle check covered dates through 7 October; it does not certify every historical annotation or the intraday quote. No backtest, Screener, alert or order was created.
Who should use this workflow?
It fits an IDX chart reader who wants consistent on-chart vocabulary for reviewing swing structure. Someone who only needs an issuer filing or a long-term valuation may not need this overlay at all. It also does not replace a market-wide Screener when the task is to find candidates across many tickers.
Use the labels to formulate a checkable question: which swing was broken, which interval is selected, and when was the break confirmed? If those answers are unclear, the label alone is not enough to support a trade thesis.
For the next checks, see volatility context on an IDX chart and large trades versus the order book. They answer different questions from market structure.
Publisher disclosure: this guide is published by Trade Inc about its own product. Screenshots are original product captures. ERAA is a demonstration ticker, not a stock recommendation.
This article is for research and information only. It is not personalized financial advice or an instruction to trade.