Which Tool Shows What an IDX Broker Is Buying and Selling?
An actual Trade Inc walkthrough: filter BK, compare net-buying and net-selling views, then isolate ERAA. Three screenshots show the controls—and why sorting is not filtering.
By Trade Inc Research

Summary
Trade Inc’s Broker heatmap lets you start with a broker code and see its estimated net activity across IDX stocks. Enter the code, choose the observation window, switch to rupiah, and inspect both the Net + and Net − views. Then narrow the matrix to a ticker you want to investigate.
This is useful when your question is “Where is this broker’s recorded buying and selling concentrated?” It does not answer “What does this institution own?” We tested the signed-in product on 4 October 2026, around 13:06–13:07 WIB, using BK and ERAA. The screenshots below show the actual controls and results, not a simulated interface.
Key takeaways
- Filter the broker row first; otherwise you are comparing a different set of participants.
- Keep the window and unit unchanged when comparing positive and negative activity.
- Net + and Net − change column ordering. They are not strict positive-only or negative-only filters.
- A row total can change when the visible ticker set changes. Do not present it as the broker’s complete market-wide balance.
- Net activity is an estimate of trading through a broker code, not proof of beneficial ownership or an instruction to copy a trade.
Start with the broker, not another stock watchlist
A stock-first table asks which brokers traded one company. This workflow reverses the question: which companies appear when you hold the broker code constant?
That distinction is useful for researchers who already follow a broker and want a shortlist for deeper work. It is materially different from an ownership database, which is intended to address reported holdings, or a Screener built around price and volume conditions.
Our earlier broker-analysis buyer guide explains how to assess evidence quality. This guide demonstrates the actual matrix controls.
Step 1: filter BK and select rupiah
Open Broker from the sidebar. In the broker-row search inside the matrix, enter BK. Leave the ticker search empty to see multiple companies. In our Indonesian-language interface, the period selector showed 30H, the 30-day selection. Select Rupiah, then Net +.
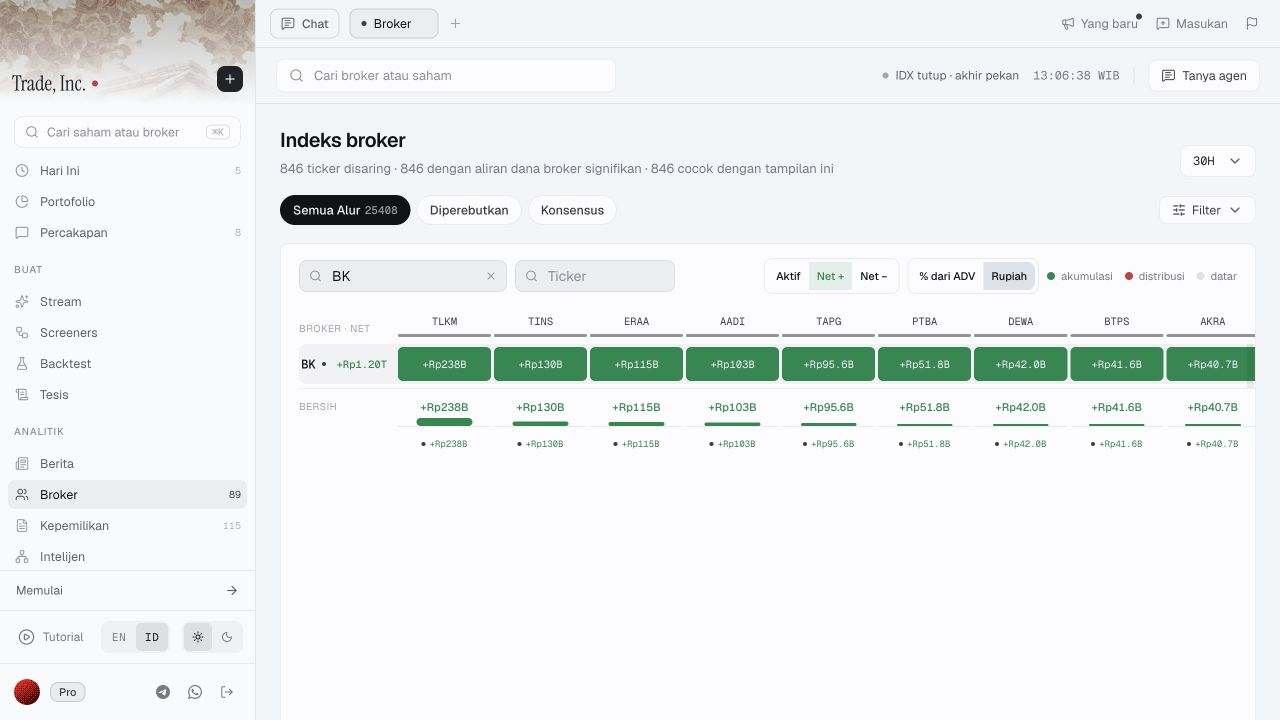
Figure 1. Actual product capture. The broker search is on the left of the matrix toolbar; the unit and sorting controls are on the right. B in the rupiah display means billion.
In this captured view, the visible columns included TLKM, TINS and ERAA. They are examples returned by the selected view, not our stock recommendations. The practical output is a research shortlist: you can identify a company to inspect without opening every stock separately.
The alternative unit is labeled % dari ADV. Do not read its percentages as returns or ownership stakes. This walkthrough uses rupiah throughout; it does not validate the ADV calculation or use that normalization to rank investment opportunities.
Step 2: inspect the other side without changing the window
Click Net −, keeping BK, Rupiah and 30H unchanged.
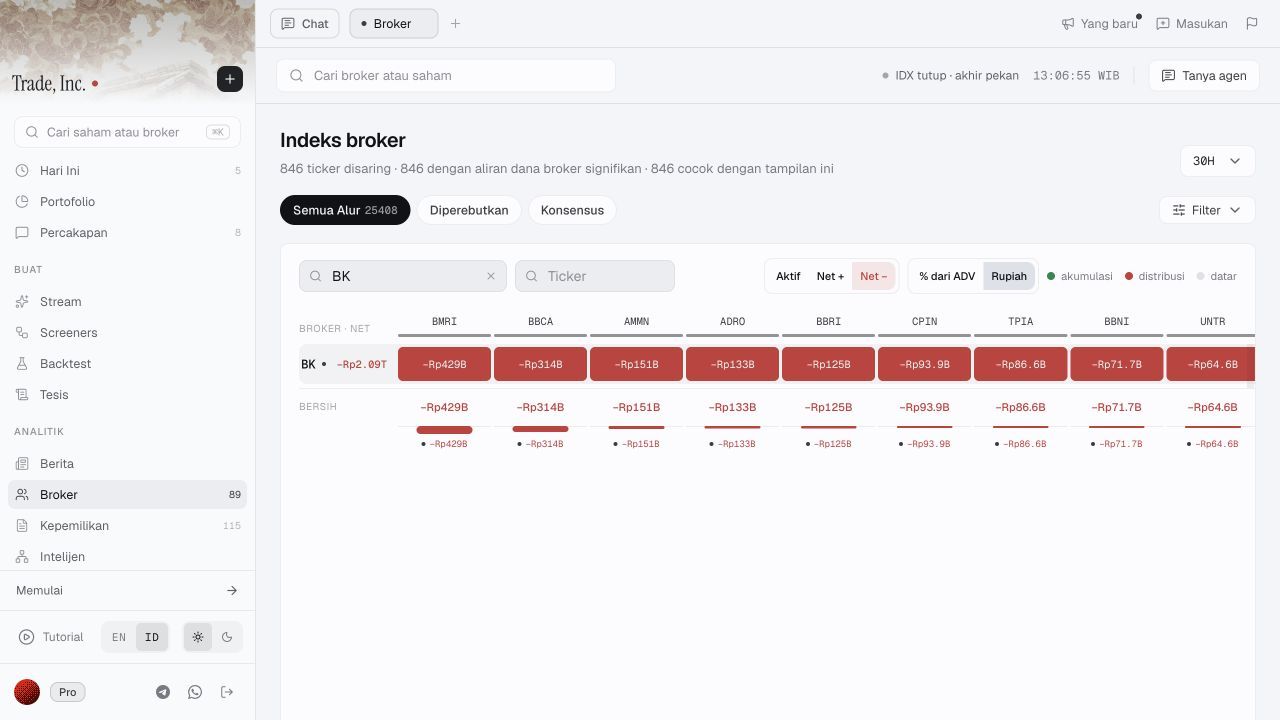
Figure 2. The changed column order surfaces negative activity. The broker and period are unchanged.
This step matters because a screen full of green cells is partly a consequence of the selected ordering. It cannot establish that the broker was a net buyer everywhere.
In our test, the displayed broker-row total changed from +Rp1.20 trillion in the positive-leading view to −Rp2.09 trillion in the negative-leading view. The loaded ticker set also changed. Those are view-dependent displayed totals—not two contradictory estimates of one complete broker portfolio. Do not quote either as the broker’s full balance without establishing the underlying coverage.
The matrix initially loaded 24 ticker columns and exposed a control to load more. A screenshot is therefore not an exhaustive inventory. The footer also states that blank cells fall below a 2% ADV threshold; a blank is not evidence of zero trading.
Step 3: isolate ERAA—and check the sign yourself
Enter ERAA in the ticker-column search. We deliberately left Net − selected.
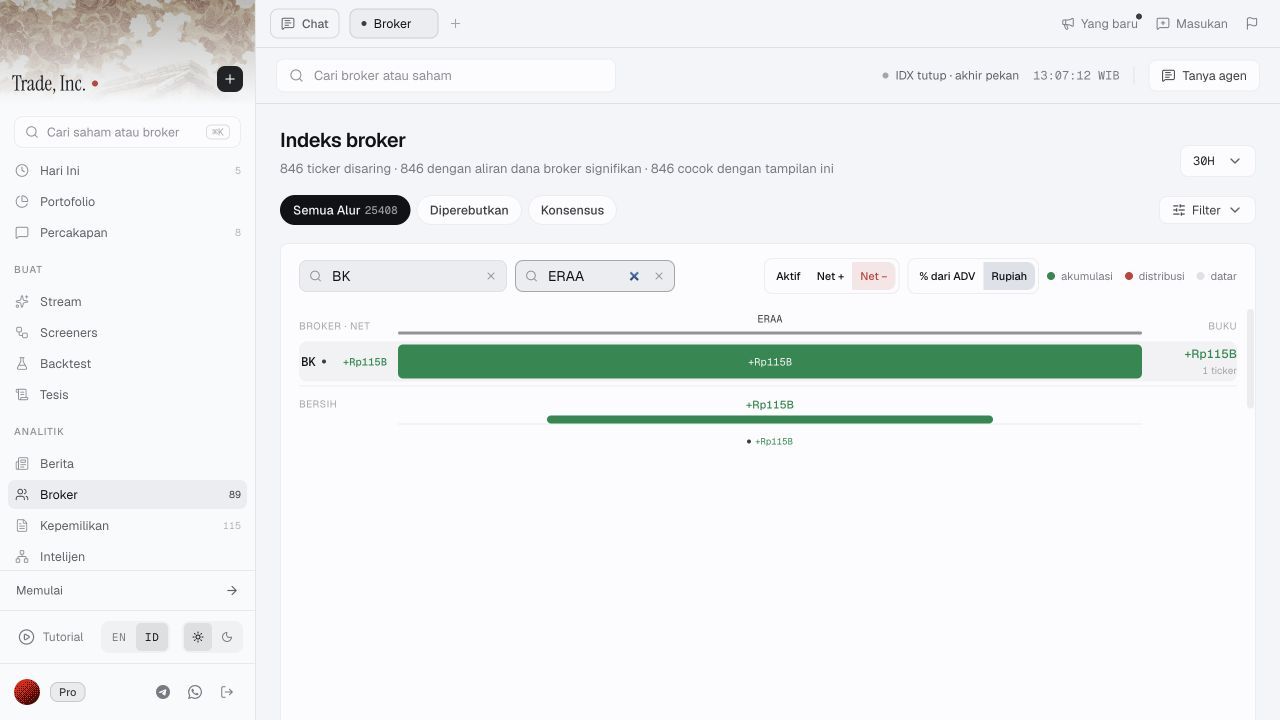
Figure 3. A positive ERAA result remains visible under Net −. Sorting and filtering are different operations.
The matrix showed +Rp115 billion. A read-only check of Trade Inc’s broker-activity estimate for BK/ERAA with a 30-day request returned net value of Rp115,046,937,000, consistent with that rounded display. It reported 21 active days and a last-observed timestamp of 3 October 2026 at 01:06 WIB.
That cross-check establishes agreement between two product surfaces for this observation. It is not an independent exchange-data reconciliation. The observation timestamp is not a trading-session timestamp, and the screen does not enumerate the precise sessions included. A 30-day selection must not be rewritten as 30 trading sessions.
Most importantly, ERAA’s positive cell remains positive even though the negative sort is active. Read the sign and selected filters, rather than inferring the result from the toolbar’s color.
What the result can—and cannot—tell you
Use the filtered result to choose the next research question: did the activity persist across sessions, how did price and liquidity behave, and was there relevant issuer news? For the news step, see our ticker-filtered news walkthrough.
Do not describe this as BK’s verified holding in ERAA. OJK defines a securities broker-dealer as a party trading for itself or others. A broker code therefore does not establish which underlying investor placed the orders. OJK Pedia: Perantara Pedagang Efek
The same caution applies to motive: client orders, different investment horizons and other trading needs can produce the recorded flow. This guide does not test any of those explanations or measure whether following the activity is profitable.
Who should use this workflow?
It fits an investor or analyst who repeatedly moves from broker-level activity to a ticker-level investigation and wants the filters, units and results in one screen.
It may add little if your existing broker table already answers that narrow question. It is not sufficient for identifying ultimate owners, reconciling every exchange transaction, or obtaining an execution recommendation. The demonstration used a signed-in account showing Pro; we did not verify access across every subscription tier, so confirm your entitlement before subscribing.
Conclusion
Use the Broker heatmap to build a shortlist, then preserve the broker code, period, unit, sort and ticker filter beside any saved observation. A useful result is one you can explain and reproduce—not simply a green cell.
Before drawing a trading conclusion, obtain explicit session coverage and independent supporting evidence. This walkthrough verifies the navigation and displayed estimate; it does not establish future returns.
Published by Trade Inc Research, part of Trade Inc. This is an affiliated product walkthrough, not an independent service ranking or investment recommendation. Product captures: 4 October 2026, 13:06–13:07 WIB. No Screener, backtest or monitoring task was created.
This article is for research and information only. It is not personalized financial advice or an instruction to trade.