Which IDX Tool Shows a Broker’s Estimated Cost—and What Does It Mean?
A real AK–ASII walkthrough separates estimated buying cost, net flow and price distance from account-level profit, with the controls and filtered result shown on screen.
By Trade Inc Research

Trade Inc’s Broker page lets you search a broker’s estimated book and compare an IDX stock’s displayed cost estimate with its latest displayed price. That is useful price context—not proof of the broker’s or its clients’ profit.
In our AK–ASII walkthrough, the row showed an estimated cost of Rp4,797, a latest price of Rp4,800 and “Belum terealisasi” of +0.1%. The informative finding is how close those two price references were, not that a particular investor had made money.
Key takeaways
- Open a broker profile, then use the ticker search inside Buku estimasi to isolate the stock.
- Read Biaya, Terakhir and Belum terealisasi together. A percentage without its price references is easy to overinterpret.
- Net buying is a transaction-flow measure. It is not the broker’s current inventory, beneficial ownership or realized profit.
- This walkthrough uses the actual authenticated product, observed on 8 October 2026 around 16:03–16:08 WIB. It is not a live recommendation.
Start with the broker, then search the estimated book
Open Broker, select AK—shown as UBS Sekuritas Indonesia—and find Buku estimasi. The search field Cari ticker sits beside the Semua, Membangun and Mengurangi tabs. Leave Semua selected for this example so a direction filter does not hide the row you want.
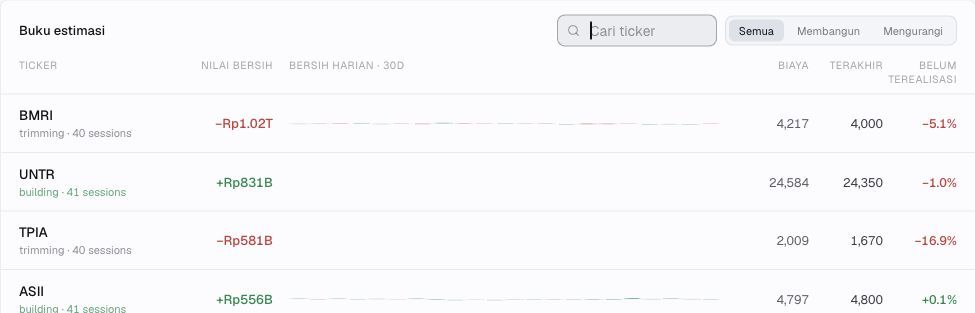
Step 1 — Click the ticker search inside the estimated book, not the global search. This crop shows the starting controls; the other rows are context, not recommendations.
Type ASII in that field and wait for the search to finish. In this demonstration the result narrowed to one row, with the footer showing 1–1 dari 1. Searching is a read-only inspection; this workflow does not create a Screener or run a backtest.

Step 2 — The filtered AK–ASII result. The image preserves the interface’s number formatting and Indonesian labels. “B” denotes billions of rupiah here.
Separate three different numbers
The profile’s net-value context was 60D; its miniature daily-flow column was labeled 30D. Those are different windows. Neither should be silently renamed “today’s buying.”
| Displayed ASII field | Observed value | What this example establishes |
|---|---|---|
| Nilai bersih | +Rp556B | Rounded positive net transaction value in the profile context |
| Biaya | Rp4,797 | Displayed cost estimate, matching the estimated average buy price in our data check |
| Terakhir | Rp4,800 | Latest price displayed at capture, not independently certified as the official close |
| Belum terealisasi | +0.1% | A rounded price-versus-estimate comparison, not an account statement |
Our read-only check for AK–ASII over 60 days returned Rp929,270,239,500 in buys and Rp373,627,558,000 in sells. Their difference is Rp555,642,681,500, consistent with the rounded +Rp556B on screen. This checks the net-value arithmetic; it does not reconstruct an investor’s holdings.
The estimated average buy price was Rp4,797.2858. Comparing the captured Rp4,800 reference against it gives:
(4,800 / 4,797.2858 − 1) × 100 ≈ 0.0566%
Rounded to one decimal place, that is +0.1%. This is a consistency check for this row, not an audit of every broker-book calculation. The interface also showed building · 41 sessions; that label does not prove one investor held ASII for 41 sessions.
Why this is not the broker’s profit
A broker code is not a named beneficial owner. Indonesia’s Ministry of Finance legal dictionary defines a securities broker-dealer as conducting securities transactions for itself or other parties. Consequently, transactions under one code cannot automatically be attributed to one investor’s account. Primary definition.
Even when a cost estimate and current price agree arithmetically, profit needs more information: opening holdings, purchases and sales attributable to the same account, how sold shares are matched to their costs, corporate-action adjustments and transaction charges. A 60-day flow window alone does not supply those records.
The competing explanation is straightforward: several clients may be trading in different directions through the same broker. Positive aggregate net flow can coexist with losing positions, profitable exits or changing participants. None is identified by this row alone.
Who should use this workflow?
It fits researchers who already have a broker–ticker question and want to inspect price context beside net flow. For example: is ASII’s displayed price near the estimated buying reference, or far from it? The answer tells you what to investigate next in the price chart and dated transaction evidence—not whether to buy.
You may not need this feature if you only want your own portfolio’s cost basis and profit: your account records are the appropriate starting point. It is also not a substitute for shareholder disclosures when your question is who owns a company.
We demonstrated the workflow in an authenticated Pro account. That verifies this account’s access at the time, not availability on every plan. The guide is published by Trade Inc about its own product; no competitor ranking is implied.
Keep the estimate useful by keeping its limits visible
Record the broker, ticker, window and capture time together. If a later quote moves further above or below the estimate, the price-distance observation changes. If the cost estimate or coverage window changes, recompute the comparison rather than carrying the old percentage forward. Neither event, by itself, establishes profit or a reliable support level.
This demonstration checked one row’s net value and price comparison. It did not audit opening inventory, all displayed statistics, transaction costs or the estimation method. Quotes can update between views. Treat the screen as a research lead, then seek the account-level or disclosure evidence required by the conclusion you want to draw.
For adjacent workflows, see how to inspect a broker’s buying and selling heatmap and what to ask of an AI broker-analysis tool.
This article is for research and information only. It is not personalized financial advice or an instruction to trade.