Which AI Tool Can Read an IDX Chart Screenshot?
Upload an HMSP chart to Trade Inc Chat: see the attachment, prompt and actual answer—and why missing dates and volume limit what the image can prove.
By Trade Inc Research

Trade Inc Chat can read an uploaded IDX chart screenshot and explain the visible price structure. In our HMSP walkthrough, it transcribed the displayed candle labels, described the rise and subsequent drop, and identified what the cropped image could not establish. That makes it useful for discussing a chart you already have—not a substitute for a market-wide pattern scan or verified price history.
This guide is published by Trade Inc. We tested our own product on 9 October 2026 in a signed-in Pro account, using the Cepat response mode. This is one documented example, not a comparison of competing tools or an accuracy benchmark. Access in other plans was not tested.
Key takeaways
- Attach the chart itself, not just a ticker, when your question concerns a specific image.
- Ask Chat to separate visible observations from interpretations and missing evidence.
- Check the answer against the original labels. A readable volume number is not a visible volume history.
- Keep the ticker, candle interval, date axis and relevant indicators in your screenshot whenever possible.
Start with a chart whose limits you understand
We opened the HMSP company page and captured its price chart. The 3M control selected the displayed range; it did not mean each candle represented three months. The crop retained the company name, candle labels and price structure, but excluded the bottom date axis and the volume panel.
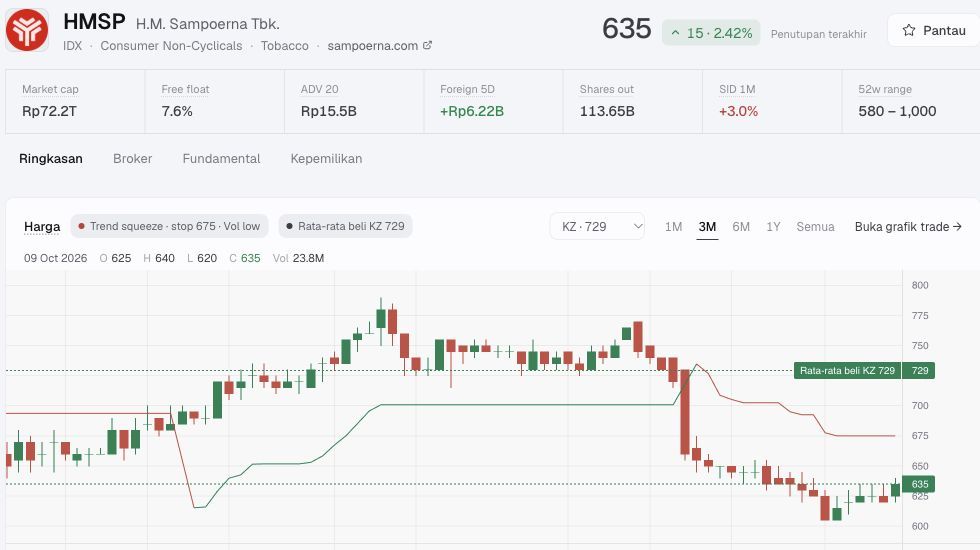
Step 1 — The exact image we uploaded. Its missing lower panels are a limitation of this example, not a recommended capture format. The cover uses the same original screenshot.
Before uploading your own image, remove account details, order information and unrelated conversations. Leave enough chart context for a reader to check your question. If the task involves timing or volume confirmation, include those panels instead of expecting the model to reconstruct them.
Attach the image and give a bounded instruction
Open Chat, press the + attachment button, choose Tambah gambar, and select the screenshot. In our test, the JPEG appeared as a filename chip. We entered the instruction below and pressed the upward-arrow Kirim button.

Step 2 — Attachment and prompt before sending. The interface was in Indonesian; the test prompt requested an English answer.
Read only this attached chart screenshot. Identify the ticker and the visible date/OHLC labels, describe the broad visible price structure, and distinguish observations from interpretations. Explicitly say what cannot be confirmed because the date axis and volume panel are cut off. Do not infer an exact pattern, price target, event cause or broker ownership from pixels. Do not fetch new data, create a Screener, run a backtest or make a recommendation. Keep it under 220 words.
That restriction matters: this demonstration asks what is visible in one image. Asking for current prices or scanning other stocks would be a different research task.
Check what the answer actually says
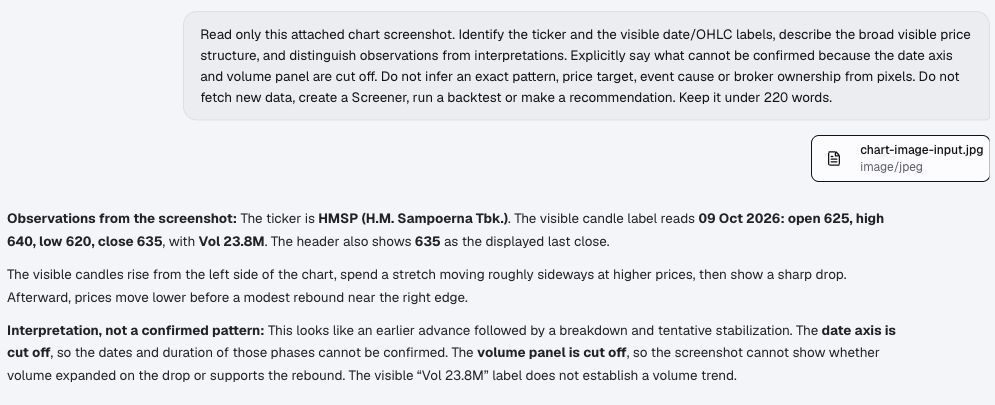
Step 3 — The completed answer, with the submitted prompt above it. The response screenshot is cropped only to exclude unrelated navigation.
Chat read HMSP, the displayed date 9 October 2026, and open 625, high 640, low 620, close 635, with Vol 23.8M. Those numbers match the labels in the input image. Here they are transcriptions of the screenshot, not independently verified final exchange prices.
The visual description also matches the broad sequence: a rise on the left, a higher sideways stretch, a sharp drop, further weakness and a small rebound at the right edge. Its suggestion of a breakdown and tentative stabilization is an interpretation—not a confirmed reversal signal.
Most importantly, the answer did not turn the single volume label into a claim about increasing volume. It said the missing panel prevented that assessment. It also declined to assign dates or durations to the earlier phases because the date axis was absent. We did not need a corrective follow-up for this scoped response.
Who should use this workflow—and who may not need it?
It fits someone who already has a chart and wants a concise explanation, a second reading of the labels, or help spotting missing context before further research. Trade Inc also presents AI research and chart analysis on its public product page; this walkthrough demonstrates the specific image-attachment workflow we observed.
You may not need Chat for simply reading a clearly labelled price. If your goal is to find double bottoms across the IDX universe, uploading one screenshot does not accomplish that scan. If you need exact calculations, request the underlying dated data and check the computation separately.
For the next step, see our guides to comparing daily and weekly charts and verifying AI-generated stock research.
The useful outcome is a checkable explanation of the image—not a confident pattern name at any cost. One clean response cannot establish reliability across blurry screenshots, other chart styles or future requests. This example is for research, not an investment recommendation.
This article is for research and information only. It is not personalized financial advice or an instruction to trade.