Which AI Tool Can Compare Up Days and Down Days for IDX Stocks?
An EXCL walkthrough separates up-day frequency from move size—and shows why 22 dated returns must reconcile before you trust an AI summary.
By Trade Inc Research

Trade Inc Chat can summarize how often an IDX stock rose or fell and the average size of each kind of move. In our EXCL example for September 2026, the checked result was 6 up days, 14 down days and 2 unchanged days, with average returns of +1.55% on up days and −1.76% on down days. But the first answer miscounted the observations: we needed two audit follow-ups before the displayed counts reconciled.
This guide shows that actual workflow, including the correction. It is useful for understanding a historical price path—not for estimating tomorrow's probability of a rise or calling the up-day share a strategy win rate.
Key takeaways
- Frequency and magnitude answer different questions: how often the close rose, and how much it moved when it did.
- The denominator is 22 September returns, using 23 closes including the 31 August baseline.
- EXCL's stored close fell from Rp2,820 on 31 August to Rp2,410 on 30 September: a 14.54% price decline, not a dividend-inclusive investor return.
- Request the input rows and reconcile the count. A confident summary can still contain arithmetic errors.
Disclosure: Trade Inc publishes this guide. We tested the signed-in Pro Chat interface on 10 October 2026, around 11:00 WIB. The public product page describes AI research and custom analysis. Our evidence is this one observed workflow, not a guarantee of identical answers or access on every plan.
1. Define an up day before asking for a count
We used a close-to-close definition: (today's close / previous stored session's close − 1) × 100. A positive result is an up day, a negative result a down day, and exactly zero an unchanged day. This differs from comparing the day's close with its own open.
Open Chat, specify EXCL, September 2026, and 31 August as the baseline. Ask for group counts, group means, the largest positive and negative dates, and the input closing prices. In the demonstrated interface, we used Cepat and pressed the upward-arrow Kirim button. We explicitly excluded new Screeners and backtests.
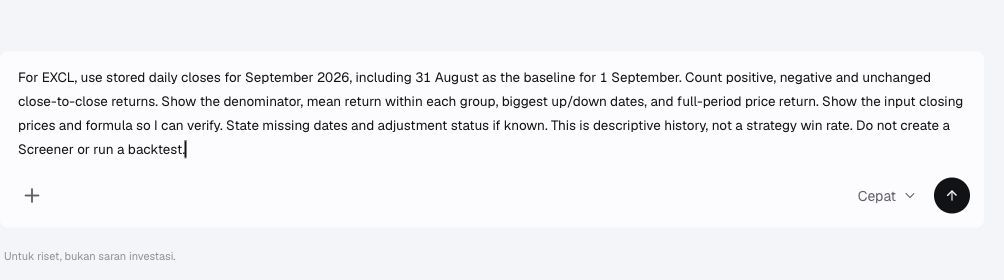
The input before pressing Kirim. The baseline belongs in the data, but not in the count of September outcomes.
Without 31 August, the 1 September return cannot be calculated. Dropping that first negative observation would change the denominator and the down-day count. Counting the baseline as another outcome would make the opposite mistake.
2. Make the summary agree with the rows
The first answer displayed the closing-price inputs correctly, but reported 21 returns, 13 negative days and a −13.00% endpoint return. Our independent calculation found 22 returns, 14 negative days and −14.54%. The first audit fixed the endpoint calculation but retained the incorrect count.
We then asked Chat to enumerate every September date with a row number and daily return, and recalculate the group counts from that list. The second follow-up produced 22 numbered observations and the corrected summary. No expected count was supplied in that follow-up.
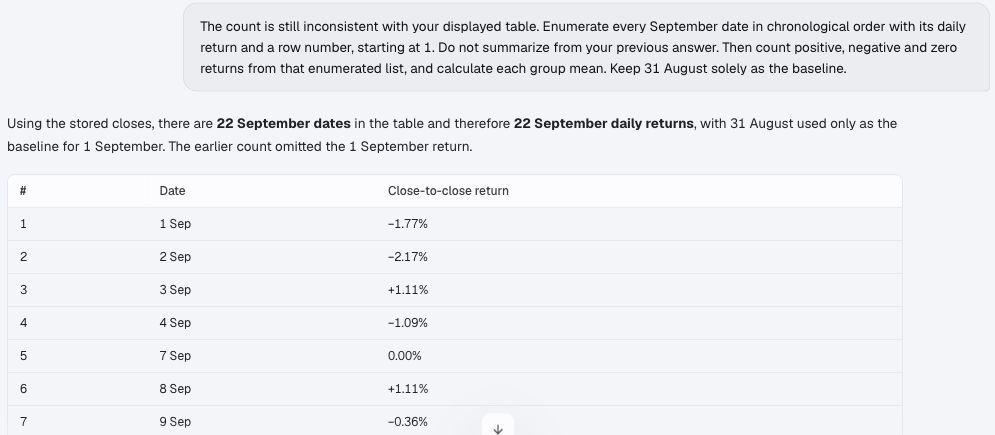
Second audit follow-up and the start of the numbered list. This is a corrected demonstration, not a first-answer accuracy claim.
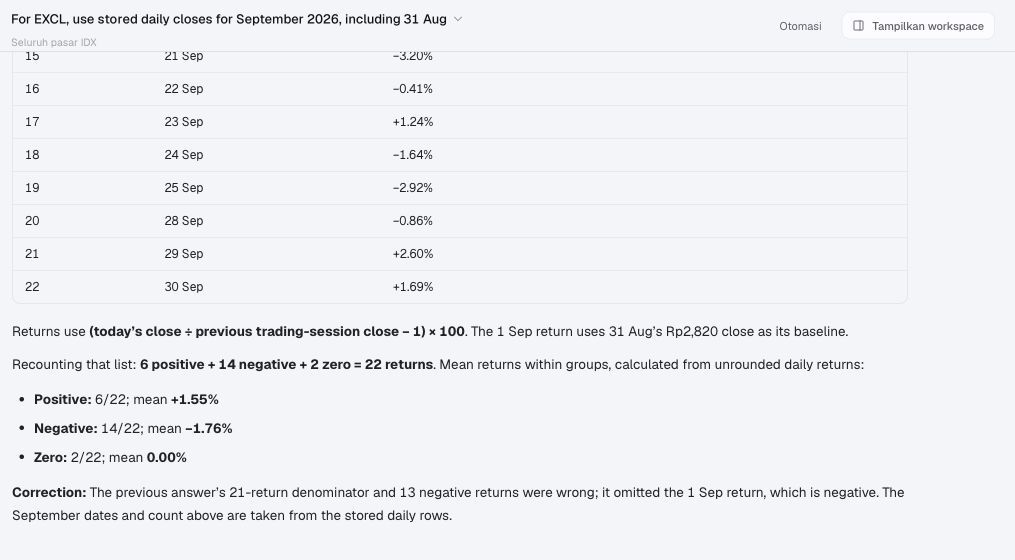
The final answer explicitly corrects its earlier denominator and negative-day count. The row numbering reaches 22.
3. Read frequency alongside the size of the move
| Stored September outcome | Count | Share of 22 observations | Mean daily return within that group |
|---|---|---|---|
| Positive | 6 | 27.27% | +1.55% |
| Negative | 14 | 63.64% | −1.76% |
| Unchanged | 2 | 9.09% | 0.00% |
The means use unrounded daily returns; the table rounds only the displayed results. In this sample, down days were both more frequent and larger in average absolute percentage size than up days. That describes September; it does not explain the cause of EXCL's decline or forecast its next month.
The largest positive close-to-close move was 29 September: Rp2,310 to Rp2,370, or +2.60%. The largest negative move was 21 September: Rp2,500 to Rp2,420, or −3.20%. Neither figure is an intraday high-to-low range or the profit of an executed trade.
The closing-price inputs behind the calculation
These are the stored Trade Inc values returned by Chat and matched against a separate read-only candle retrieval. Prices are rupiah per share; all dates are in 2026. The two date columns are only a compact layout, not paired comparisons.
| Date | Close (Rp) | Date | Close (Rp) |
|---|---|---|---|
| 31 Aug, baseline | 2,820 | 16 Sep | 2,540 |
| 1 Sep | 2,770 | 17 Sep | 2,580 |
| 2 Sep | 2,710 | 18 Sep | 2,500 |
| 3 Sep | 2,740 | 21 Sep | 2,420 |
| 4 Sep | 2,710 | 22 Sep | 2,410 |
| 7 Sep | 2,710 | 23 Sep | 2,440 |
| 8 Sep | 2,740 | 24 Sep | 2,400 |
| 9 Sep | 2,730 | 25 Sep | 2,330 |
| 10 Sep | 2,700 | 28 Sep | 2,310 |
| 11 Sep | 2,630 | 29 Sep | 2,370 |
| 14 Sep | 2,550 | 30 Sep | 2,410 |
| 15 Sep | 2,550 | — | — |
For example, 1 September is (2,770 / 2,820 − 1) × 100 = −1.77305%. The whole-window price change is (2,410 / 2,820 − 1) × 100 = −14.53901%. It is not the sum of rounded daily returns. We also checked that compounding the unrounded daily returns reproduces the endpoint change.
What the sample cannot tell you
This is one stock over one month, chosen as a product demonstration, not a representative market sample. The checked slice has 22 stored September observations and one baseline, with no reconstructed bars flagged. We did not independently reconcile the slice against an official exchange calendar or establish corporate-action adjustment status. Treat it as a stored-price calculation, not a certified total-return series.
Dividends, fees, slippage, entry rules and exit rules are not modeled. There are no evaluated trades, so 6/22 is an up-day frequency, not a strategy win rate. A different window, corrected input history or different return definition changes the result. A flat close also says nothing about how far price moved during the session.
When this workflow is useful
Use it when you want a conversational breakdown of a historical move and are willing to check the data and arithmetic. Ask for the rows before interpreting the percentages. If you already have a clean price series and only need a fixed count and mean, a spreadsheet is enough; Chat adds the interactive explanation, not a reason to abandon verification.
For another risk question, see maximum drawdown, which follows the peak-to-trough path rather than grouping days by sign. For two stocks moving together, see the return-correlation walkthrough.
The practical test is simple: count the dated rows, reconcile positive + negative + unchanged, then inspect the size of each group's moves. If those checks fail, stop at the calculation—not at an investment conclusion.
This article is for research and information only. It is not personalized financial advice or an instruction to trade.