Which AI Tool Can Calculate Maximum Drawdown for IDX Stocks?
A real TLKM chat walkthrough separates a 16.67% peak-to-trough decline from a 13.79% period loss—with the complete price table, a corrected coverage note and explicit data limits.
By Trade Inc Research

Summary
Trade Inc chat can calculate a stock’s historical close-to-close drawdown and expose the underlying price table. In our signed-in Pro-account test on 4 October 2026, it calculated TLKM’s maximum drawdown as 16.67% over 1 September–2 October, compared with a 13.79% first-to-last close loss. A separate calculation from Trade Inc’s stored candles matched both results.
The useful feature is the inspectable calculation, not a prediction. We also found a calendar qualification that needed correction. This walkthrough shows the request, result and follow-up rather than treating an AI response as verified by default.
Publisher disclosure: this guide is produced by Trade Inc Research about its own product. This is one observed workflow, not an independent ranking or an accuracy benchmark. Market-data cutoff: 2 October 2026.
Key takeaways
- Ask for the ticker, exact dates, daily closes and a running-peak table—not simply “how risky is this stock?”
- Maximum drawdown measures a decline from an earlier peak. Period return compares only the first and last observations.
- The TLKM arithmetic matched a separate same-system calculation; that does not independently validate the original market data.
- Price-adjustment status and exchange-calendar completeness remained unverified. Neither was silently assumed.
Start with a bounded question in chat
Open Trade Inc’s Percakapan / Chat, start a new conversation and enter the stock and inclusive date range. Our session used Cepat response mode in an account displaying Pro; press Kirim / Send after entering the request. This observation does not establish the minimum subscription tier, current usage allowance or identical availability in every account.
The request specified TLKM, 1 September through 2 October 2026, daily closing prices, maximum drawdown, peak and trough dates, endpoint return, and a complete date/close/running-peak/drawdown table. It also asked about missing sessions and adjustment status. We explicitly excluded creating a Screener, backtest, alert or monitoring task.
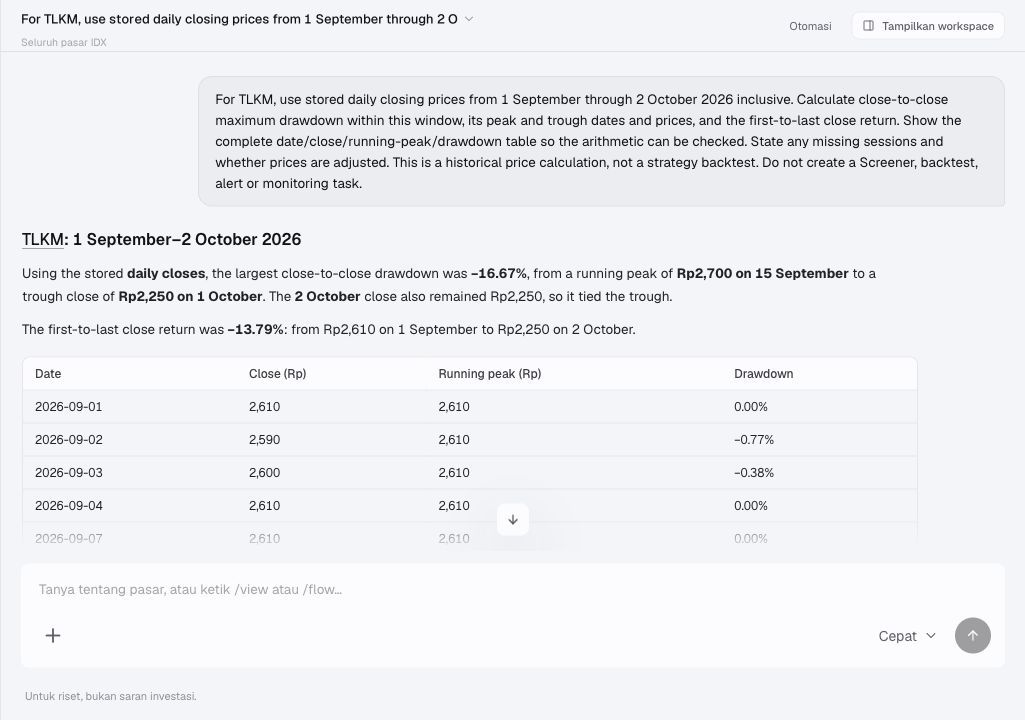
Figure 1. Actual product use: the submitted request appears above the response. Chat returned the peak, trough, endpoint loss and row-level calculation. The unrelated conversation sidebar is cropped out.
A bounded request makes the answer testable. A rolling “last month” request can change between readers; a fixed date range makes comparisons possible. Specifying closes also avoids quietly mixing a daily high with a closing-price trough.
Why 16.67% and 13.79% are both correct
The first close in the stored window was Rp2,610 on 1 September. The series subsequently reached Rp2,700 on 15 September, before falling to Rp2,250 on both 1 and 2 October. Prices here are rupiah per share.
| Measure | Calculation | Result |
|---|---|---|
| First-to-last close return | 2250 / 2610 − 1 | −13.79% |
| Worst decline from a prior closing peak | 2250 / 2700 − 1 | −16.67% |
| Gain needed to regain that peak from 2250 | 2700 / 2250 − 1 | +20.00% |
The third row is our arithmetic illustration, not a chat forecast. A 16.67% decline and a 20% recovery use different denominators. Neither tells you whether recovery will happen.
At each date, the running peak is the highest close observed up to that date within the chosen window. Divide the current close by that peak and subtract one. The most negative observation is −16.67%; expressed as a loss magnitude, maximum drawdown is 16.67%. The MSCI IndexMetrics methodology, page 51, similarly defines maximum drawdown through a peak-to-trough decline over the analysis period. Our example applies that concept to stored stock closes, not an MSCI index.
Chronology matters. Comparing the highest and lowest values without checking their order can manufacture a drawdown from a low that occurred before the peak.
Challenge the coverage note, not just the number
The first response unnecessarily singled out 5 September as an absent date whose trading-session status was uncertain. That date was a Saturday. We asked chat to distinguish absent calendar dates from missing expected exchange sessions.
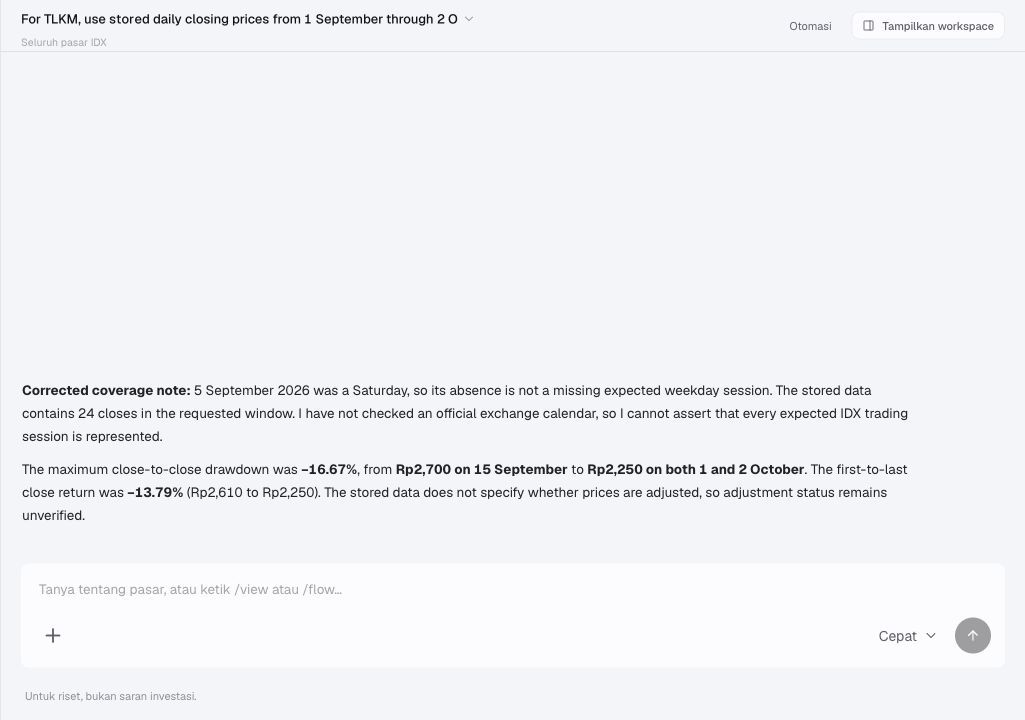
Figure 2. Actual follow-up and correction. The corrected response retains both numerical results, identifies both trough dates, and explicitly declines to claim exchange-calendar completeness or verified price adjustments.
The correction does not prove the dataset is complete. It fixes an imprecise qualification. We counted 24 stored closes, but did not reconcile them against an official exchange calendar; “24 observations returned” is the supported statement. Similarly, absence of an adjustment label does not prove that prices are unadjusted.
This distinction matters when evaluating an AI research tool: correct arithmetic and correct data qualifications are separate checks. Ask the tool to expose both.
Who this workflow fits—and who may not need it
This is useful for an investor who wants an auditable price-path explanation in the same conversation as other stock research. You can inspect the peak, trace the decline and ask a focused follow-up without accepting a single opaque risk score.
If you already maintain a clean adjusted-price spreadsheet, the formula is simple enough to calculate there. This one-stock demonstration does not establish automated portfolio risk reporting, bulk exports or a dedicated drawdown dashboard. Nor does it verify unrestricted code execution: the observed output is a chat calculation and table.
For strategy evaluation, a stock-price decline is not a substitute for a portfolio equity curve. Entry and exit rules, position sizes, cash, fees, slippage and dividends can change the strategy’s result. No new strategy backtest was run for this article.
Limitations that change the interpretation
This is window-specific, daily-close, stored-price drawdown. An earlier peak outside the window is excluded. Intraday losses can differ. The unrecovered peak at the cutoff does not identify a final cycle trough.
We checked arithmetic against a second retrieval from the same Trade Inc data system, not against independent exchange records. Unknown adjustment treatment matters around corporate actions. The calculation excludes any separate dividend reinvestment, costs or investor cash flows and must not be labeled total shareholder return or an individual investor’s realized loss.
TLKM was a demonstration case, not a recommendation or a claim that its risk is representative of IDX stocks. One successful calculation does not measure the tool’s overall reliability.
Conclusion
Choose a research workflow that lets you inspect the input series, reproduce the denominator and challenge the qualifications. Here, Trade Inc chat produced a checkable drawdown calculation and responded to a targeted correction. Use that transparency to investigate historical downside—not to treat the worst loss in a short window as a ceiling on future losses.
Appendix: the complete calculation window
Source: Trade Inc stored daily closes retrieved on 4 October 2026, with editorial recalculation. Drawdowns are rounded to two decimal places; running peaks reset at the beginning of this window.
| Date | Close (Rp/share) | Running peak (Rp) | Drawdown |
|---|---|---|---|
| 2026-09-01 | 2610 | 2610 | 0.00% |
| 2026-09-02 | 2590 | 2610 | -0.77% |
| 2026-09-03 | 2600 | 2610 | -0.38% |
| 2026-09-04 | 2610 | 2610 | 0.00% |
| 2026-09-07 | 2610 | 2610 | 0.00% |
| 2026-09-08 | 2650 | 2650 | 0.00% |
| 2026-09-09 | 2660 | 2660 | 0.00% |
| 2026-09-10 | 2630 | 2660 | -1.13% |
| 2026-09-11 | 2600 | 2660 | -2.26% |
| 2026-09-14 | 2690 | 2690 | 0.00% |
| 2026-09-15 | 2700 | 2700 | 0.00% |
| 2026-09-16 | 2660 | 2700 | -1.48% |
| 2026-09-17 | 2590 | 2700 | -4.07% |
| 2026-09-18 | 2560 | 2700 | -5.19% |
| 2026-09-21 | 2500 | 2700 | -7.41% |
| 2026-09-22 | 2470 | 2700 | -8.52% |
| 2026-09-23 | 2440 | 2700 | -9.63% |
| 2026-09-24 | 2410 | 2700 | -10.74% |
| 2026-09-25 | 2410 | 2700 | -10.74% |
| 2026-09-28 | 2370 | 2700 | -12.22% |
| 2026-09-29 | 2370 | 2700 | -12.22% |
| 2026-09-30 | 2290 | 2700 | -15.19% |
| 2026-10-01 | 2250 | 2700 | -16.67% |
| 2026-10-02 | 2250 | 2700 | -16.67% |
Related research
This article is for research and information only. It is not personalized financial advice or an instruction to trade.