Which AI Chat Can Show Whether a Dividend Covers a Share-Price Loss?
A real Chat walkthrough separates a hypothetical 6% dividend yield from returns of −4.37%, 0.61% and 5.59% after trading fees, with inputs, results and a checked break-even price.
By Trade Inc Research

Trade Inc Chat can turn explicit dividend, purchase-price and transaction-fee assumptions into a checkable total-return table. In our actual product test, a hypothetical 6% gross dividend yield coexisted with a 4.37% loss when the selling price was 10% below the purchase price.
That makes the useful buyer question more precise: can the tool distinguish cash income from the return on all the money you paid? A dividend percentage alone does not answer that question.
Key takeaways
- Supply share count, purchase price, cash dividend, both fees and possible selling prices. Ask for the formulas as well as the answer.
- Keep gross dividend yield, price-only return and total return in separate columns.
- Use initial cash outlay including the purchase fee as the denominator when evaluating this cash-flow example.
- This is a hypothetical holding-period calculation, not an issuer forecast, annualized return, backtest or dividend-capture strategy.
Enter the assumptions in Chat, then send
Open Trade Inc Chat. We used an authenticated Pro account, left the response mode at Cepat, entered the request and clicked the upward-arrow Kirim button. The screenshots were captured on 8 October 2026 around 17:03–17:05 WIB.
The request used 1,000 shares at Rp5,000, a 0.15% purchase fee, Rp300 per share in cash dividends, and a 0.25% selling fee. It asked for sales at Rp4,500, Rp4,750 and Rp5,000. All figures are invented scenario inputs; no real ticker or market quote is involved.
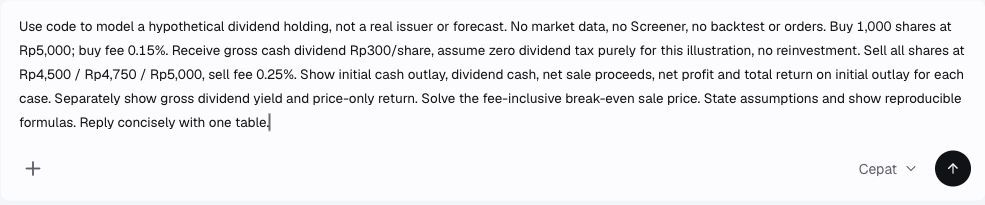
Step 1 — Enter the full assumptions and click the arrow at the lower right. The request explicitly excludes market-data retrieval, Screeners, backtests and orders.
For a reusable request, ask: “Compare dividend cash plus net sale proceeds against my initial cash outlay, including both fees. Show gross dividend yield separately and solve the theoretical break-even sale price.” Then insert your own verified inputs.
We also specified no reinvestment, no other costs and zero dividend tax solely as a modeling assumption. This is not a statement that Indonesian dividends are always tax-free. Actual eligibility, payment timing and applicable tax treatment must be established separately.
Read the result as a cash bridge
Chat returned the requested table, assumptions and formulas. We independently reproduced every scenario rather than relying on the response’s formatting or confidence.
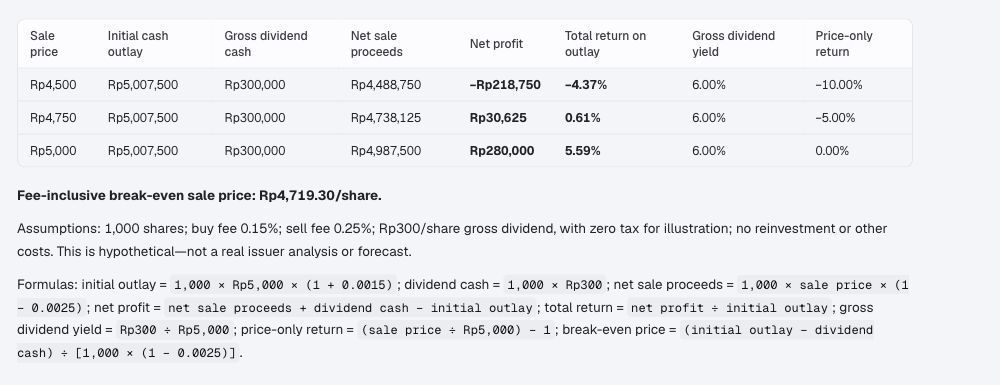
Step 2 — Inspect the result. The 6.00% dividend-yield column is unchanged, while total return ranges from negative to positive. The screenshot uses English number formatting.
Initial outlay is Rp5,007,500: Rp5,000,000 for the shares plus Rp7,500 in purchase fees. Dividend cash is Rp300,000 in every case. The following values assume that the full dividend is received and all shares are sold at the specified price.
| Hypothetical sale price | Net sale proceeds | Net profit/loss including dividend | Total return on outlay | Price-only return |
|---|---|---|---|---|
| Rp4,500 | Rp4,488,750 | −Rp218,750 | −4.37% | −10.00% |
| Rp4,750 | Rp4,738,125 | Rp30,625 | 0.61% | −5.00% |
| Rp5,000 | Rp4,987,500 | Rp280,000 | 5.59% | 0.00% |
The gross dividend yield on the assumed purchase price is Rp300 ÷ Rp5,000 = 6%. It is neither a forecast nor an annual yield unless a corresponding annual period is established. In the lowest-price case, the dividend does not cover the price loss and fees. At an unchanged selling price, fees reduce the modeled return below 6%.
The distinction is consistent with Investor.gov’s stock primer, which treats dividends and capital appreciation separately and explains that stock purchases and sales involve fees. That source supports the general concepts—not our hypothetical rates, Indonesian tax assumptions or Trade Inc’s product capabilities.
Check the break-even price instead of guessing from yield
The reproducible formulas are:
Outlay = shares × buy price × (1 + buy fee)
Profit = shares × sale price × (1 − sell fee) + dividend cash − outlay
Total return = profit ÷ outlay
Setting profit to zero gives Rp4,719.30 per share, rounded:
(Rp5,007,500 − Rp300,000) ÷ [1,000 × (1 − 0.0025)]
This is a theoretical algebraic threshold, not a valid order-price instruction or a guaranteed fill. We did not map it to exchange price increments or test available liquidity. Lower net dividend cash or higher costs would raise the break-even threshold; a higher dividend would lower it, with all other assumptions unchanged.
When Chat adds value—and when it does not
Chat is useful when you want to change several assumptions and ask why a result changes, while keeping the explanation and calculations together. For one fixed calculation, a spreadsheet may be sufficient; this arithmetic alone is not a reason to subscribe.
The demonstration verifies a correct numerical response in this Pro account, not every plan’s entitlement or the accuracy of future answers. Although the request asked for code, the visible response showed formulas and results, not an independently inspectable execution record. We therefore do not claim this test proves code execution.
Trade Inc publishes this guide about its own product. No stock was purchased or sold, no portfolio was modified, and no new Screener or backtest was created.
Before applying the workflow to a real holding, replace assumptions with the actual entitlement, cash received, charges and sale proceeds. Do not add a dividend again if your starting performance series already includes it. The useful output is a reconciled cash bridge—not a promise that a high-yield stock will make money.
Related walkthroughs: compare rights-issue choices in Chat and separate stock returns from currency effects.
This article is for research and information only. It is not personalized financial advice or an instruction to trade.