Which AI Tool Can Stress-Test a DCF Valuation’s Terminal Assumptions?
A real Pro Chat walkthrough separates operating value from equity value and checks nine DCF scenarios. The hypothetical base case depends on terminal cash flows for 67.6% of operating value.
By Trade Inc Research

Trade Inc Chat can help audit a discounted cash-flow calculation and show how its assumptions change the answer. In our Pro-account demonstration on 11 October 2026, a hypothetical business produced Rp1,020.75 per share in the base case—but Rp818.98 to Rp1,354.68 across the specified sensitivity grid. Those are model outputs, not price targets.
The workflow is custom analysis in Chat, not a dedicated DCF module or an automatic valuation of an IDX issuer. Trade Inc publishes this guide about its own product.
Key takeaways
- Ask for the cash-flow calculation, the equity bridge and sensitivity—not just one “fair value.”
- In this example, 67.6% of operating value comes from cash flows after year five.
- Chat's first response matched our independent arithmetic check. That verifies this calculation, not the economic assumptions or general AI accuracy.
Step 1: specify the model before pressing Send
Open Trade Inc Chat and start a new conversation. We entered the assumptions below, left Cepat selected in the Indonesian interface and pressed Kirim, the upward-arrow button at the lower right.
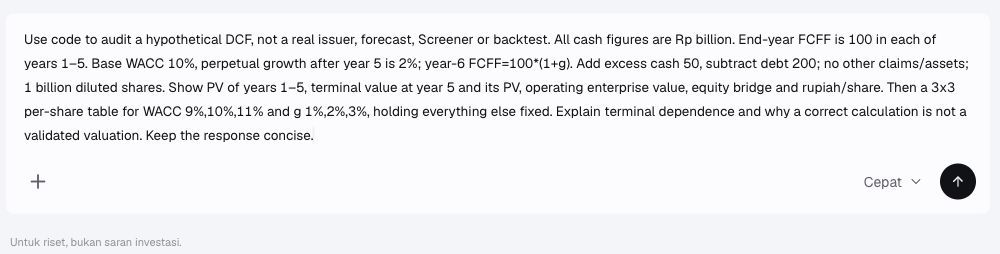
The setup screen before sending. No real company, portfolio, Screener or backtest is involved.
All cash amounts are Rp billion, except the final rupiah-per-share figure. The invented business generates free cash flow to the firm (FCFF) of 100 at each year-end in years 1–5. FCFF is cash available to capital providers after operating needs and reinvestment, before debt financing payments.
We specify a 10% weighted average cost of capital (WACC), 2% perpetual growth after year five, excess cash of 50, debt of 200 and one billion diluted shares. There are no other assets or claims in this simplified example. The growth and discount rates are assumptions, not recommended rates for Indonesian stocks.
Ask Chat to show each present value, the terminal value, the bridge to equity, and a nine-cell table using WACC of 9%, 10% and 11% against growth of 1%, 2% and 3%. Hold the first five cash flows and the balance-sheet bridge fixed.
Step 2: separate operating value from shareholder value
Discounting brings future cash flows back to today's model value. Cash flows to the firm and cash flows to equity require different discount rates; Damodaran's valuation framework explains that distinction. This example uses FCFF and WACC throughout.
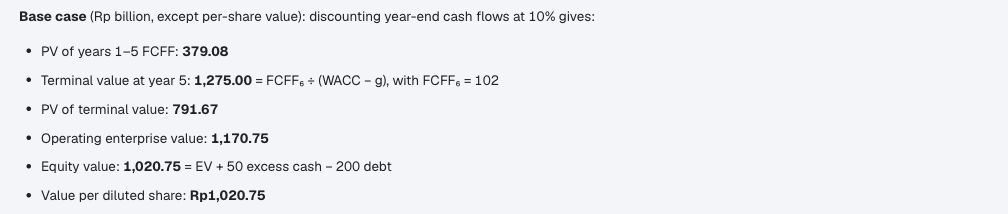
The first response separated operating enterprise value from equity value rather than dividing operating value directly by shares.
| Base-case component | Rp billion, unless stated |
|---|---|
| Present value of years 1–5 | 379.08 |
| Year-six FCFF: 100 × 1.02 | 102.00 |
| Terminal value at end of year five: 102 ÷ (0.10 − 0.02) | 1,275.00 |
| Present value of terminal value: 1,275 ÷ 1.10⁵ | 791.67 |
| Operating enterprise value | 1,170.75 |
| Add excess cash; subtract debt | +50.00; −200.00 |
| Equity value | 1,020.75 |
| Value per diluted share, rupiah | 1,020.75 |
The first line is the sum of 100 ÷ 1.10ᵗ for t = 1 through 5. Equity value then equals operating value + excess cash − debt. Dividing Rp1,020.75 billion by one billion shares gives Rp1,020.75 per share. Calculations use unrounded values; displayed figures are rounded.
The stable-growth terminal approach represents cash flows beyond the explicit forecast period. Its end-year-five value must still be discounted; adding 1,275 directly to 379.08 would mix dates.
Step 3: inspect the assumption sensitivity
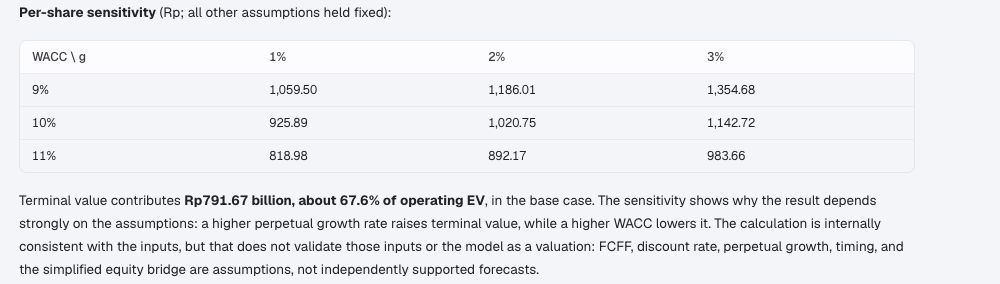
The returned grid changes both year-six cash flow and the terminal denominator when growth changes.
| WACC | Growth 1% | Growth 2% | Growth 3% |
|---|---|---|---|
| 9% | Rp1,059.50 | Rp1,186.01 | Rp1,354.68 |
| 10% | Rp925.89 | Rp1,020.75 | Rp1,142.72 |
| 11% | Rp818.98 | Rp892.17 | Rp983.66 |
Each cell is rupiah per diluted share. This is a sensitivity grid, not a probability range or confidence interval. All nine values matched our independent calculation without a corrective follow-up.
The terminal share is 791.67 ÷ 1,170.75, approximately 67.6%, using unrounded inputs. That does not make the model wrong. It identifies where further evidence matters: the sustainability of cash generation after year five. A higher growth assumption cannot substitute for evidence about reinvestment and returns on that investment.
Who needs this workflow—and who does not?
The public product page lists AI research and custom analysis under Pro. Our demonstration verifies this specific Chat workflow in a Pro account, not a specialist valuation feature or entitlement on every plan.
Chat is useful when you want a conversational explanation of the model and its weakest assumptions. A spreadsheet is sufficient if you already have a controlled model and only need the arithmetic. This demonstration does not show automated issuer forecasting, audited inputs or investment suitability.
For a real company, substantiate the cash flows, reinvestment, financing claims, excess-cash classification and diluted share count before interpreting the output. Currency and nominal-versus-real assumptions must be consistent. Sustainable growth must remain below the discount rate in this model. Evidence of weaker cash conversion or additional claims would weaken the valuation; supported cash generation and a reconciled balance sheet would make the inputs more defensible, not guarantee the share price.
For adjacent checks, see why EBITDA is not shareholder cash and our margin and P/E sensitivity walkthrough. The useful result here is an auditable set of assumptions—not a buy or sell instruction.
This article is for research and information only. It is not personalized financial advice or an instruction to trade.