Which AI Chat Can Stress-Test Profit Margins and P/E Assumptions?
A real chat walkthrough turns explicit assumptions into an earnings bridge, a P/E sensitivity table and inspectable code—without mistaking a scenario for fair value.
By Trade Inc Research

Summary
Trade Inc chat can turn explicit earnings assumptions into a sensitivity table and supply code you can inspect. In our signed-in Pro demonstration on 6 October 2026, a hypothetical 10% revenue decline combined with a gross-margin drop from 30% to 27% reduced modeled net profit by 57%. The calculations reproduced independently; they are not an issuer forecast or evidence that any stock is cheap.
This workflow answers a question a single P/E ratio cannot: how much of an apparent valuation cushion disappears if the earnings denominator weakens? It is different from screening for low multiples or sizing a trading position.
Publisher disclosure: this guide is produced by Trade Inc, the product demonstrated. Screenshots show our actual chat session, not a mock-up. The example uses invented inputs, not company financial data.
Key takeaways
- Specify revenue, gross margin, fixed costs, interest, tax treatment and shares before asking for a valuation table.
- Separate a revenue shock from a margin shock before combining them. This exposes the source of the earnings change.
- An assumed P/E converts EPS into an implied price; it does not establish the right multiple or an executable market price.
- The chat supplied code and explicitly said it had not executed that code. We separately checked the arithmetic; this demonstration does not prove in-chat execution.
1. Enter the assumptions, then press Send
Open a new conversation in Trade Inc. We used Cepat response mode in a signed-in Pro account. Enter a one-year scenario request, then press the upward-arrow Send/Kirim button at the lower right. This verifies access in that account, not an entitlement guarantee for every plan.
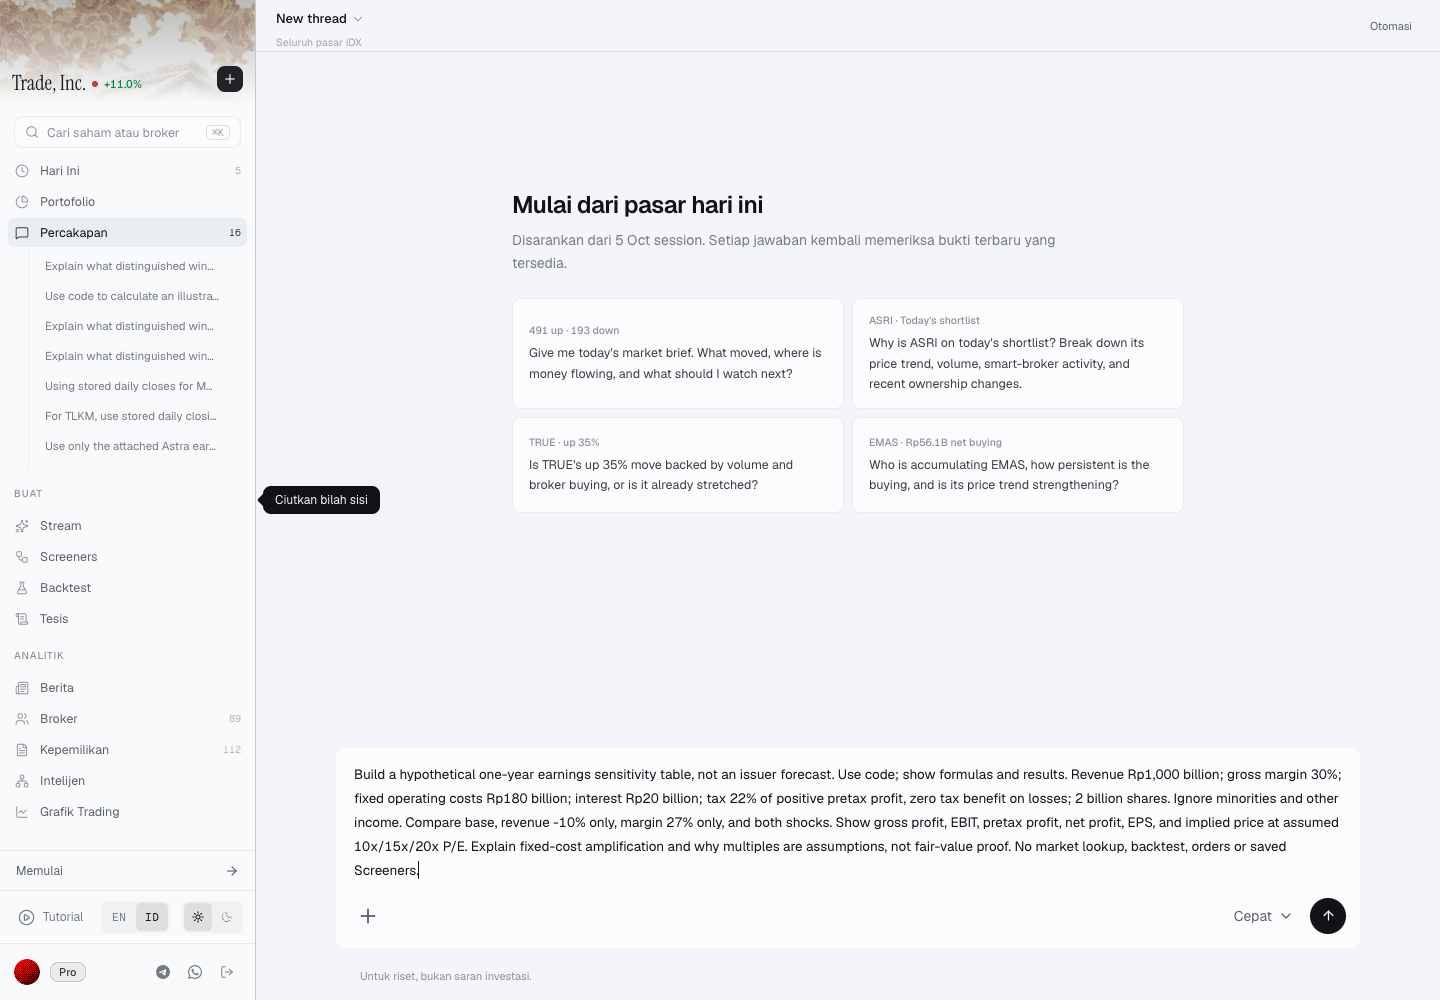
Step 1: the request is entered before submission. The unrelated market suggestion cards above it are not inputs to this calculation.
Our inputs were annual revenue of Rp1,000 billion, gross margin 30%, fixed operating costs Rp180 billion, interest Rp20 billion, and 2 billion shares. We assumed tax of 22% of positive pretax profit, with no tax benefit on a loss. That tax rate is a modeling choice here, not a statement of an issuer's effective tax rate. We excluded minority interests and other income.
The request compared four cases: base, revenue down 10% alone, margin down to 27% alone, and both shocks. We asked for gross profit, operating profit before interest and tax (EBIT), pretax profit, net profit, earnings per share (EPS), and prices implied by assumed 10×, 15× and 20× P/E ratios. No market lookup, orders, backtest or new Screener was needed.
For a real issuer, first reconcile the inputs to its financial statements. Do not combine half-year revenue with full-year expenses, or consolidated profit with an EPS denominator that needs profit attributable to ordinary shareholders. Banks and other financial firms may require a different model rather than this gross-margin structure.
2. Read the earnings bridge before the price columns
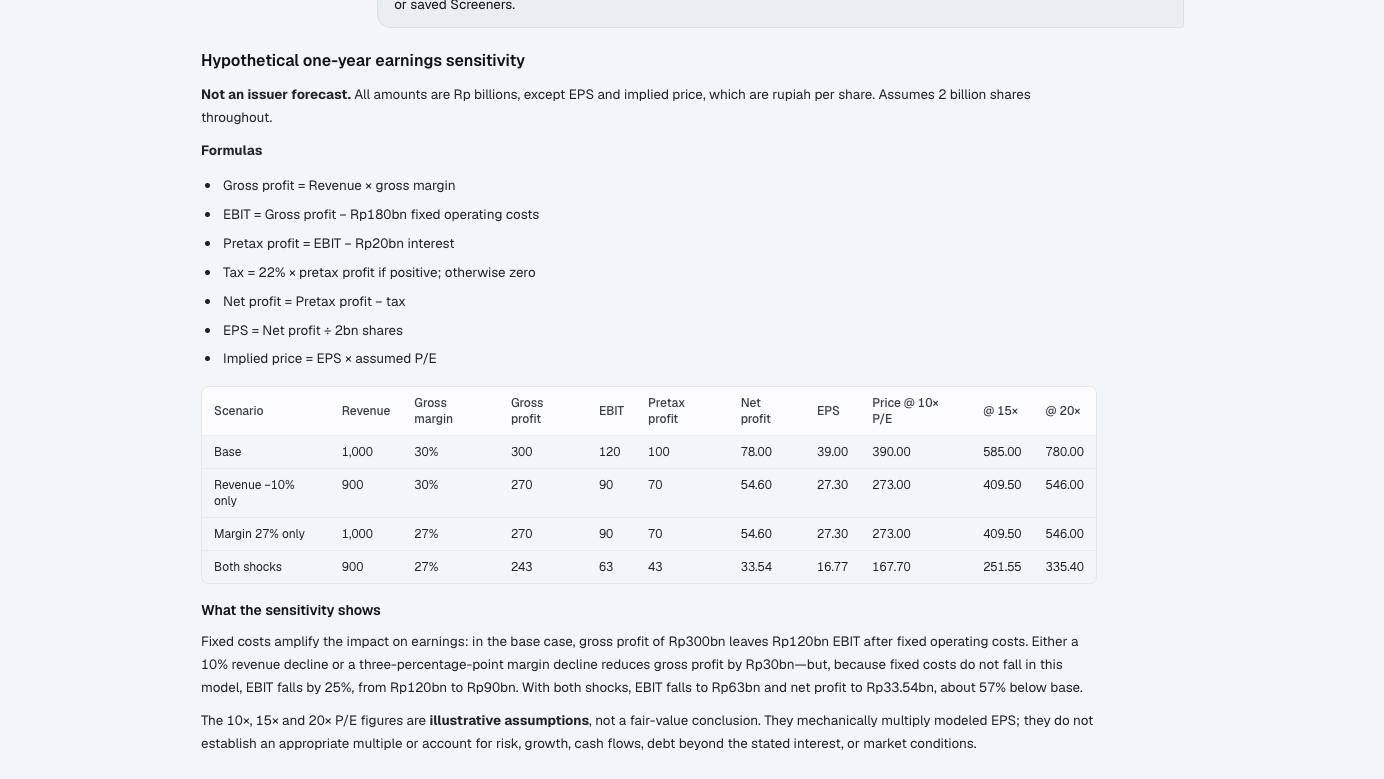
Step 2: the actual response shows formulas, scenario results and qualifications. All financial-statement amounts below are Rp billion; EPS is rupiah per share.
| One-year scenario | Revenue | Gross profit | EBIT | Pretax profit | Net profit | EPS (Rp) |
|---|---|---|---|---|---|---|
| Base: 30% margin | 1,000 | 300 | 120 | 100 | 78.00 | 39.00 |
| Revenue −10%; margin unchanged | 900 | 270 | 90 | 70 | 54.60 | 27.30 |
| Margin 27%; revenue unchanged | 1,000 | 270 | 90 | 70 | 54.60 | 27.30 |
| Both shocks | 900 | 243 | 63 | 43 | 33.54 | 16.77 |
The combined case starts with Rp243 billion gross profit: 900 × 27%. Subtract Rp180 billion fixed costs and Rp20 billion interest to get Rp43 billion pretax profit. After the assumed tax, Rp33.54 billion divided by 2 billion shares produces Rp16.77 EPS.
The mechanism is fixed-cost amplification. Each isolated shock reduces gross profit by Rp30 billion, but EBIT falls 25% and net profit falls 30% because operating costs and interest do not decline. Together, the shocks reduce net profit from Rp78 billion to Rp33.54 billion: 57%, not the sum of two 30% earnings declines. Revenue and margin interact multiplicatively.
That result depends on holding costs constant. If management can cut expenses, the modeled downside is too severe; if financing costs rise or margins deteriorate further, it is too mild. The table identifies assumptions to investigate, not the likelihood of each outcome.
3. Treat P/E as a second assumption—not a verdict
| Scenario EPS | Price at 10× (Rp) | At 15× (Rp) | At 20× (Rp) |
|---|---|---|---|
| Base: Rp39.00 | 390.00 | 585.00 | 780.00 |
| Either isolated shock: Rp27.30 | 273.00 | 409.50 | 546.00 |
| Both shocks: Rp16.77 | 167.70 | 251.55 | 335.40 |
These are mechanical products of EPS and a chosen multiple, not price targets or exchange-valid order prices. Holding P/E at 15× produces Rp585 in the base case and Rp251.55 with both shocks. Holding the multiple constant isolates the earnings effect; it does not predict that investors would retain that multiple.
Aswath Damodaran's NYU discussion of P/E determinants connects multiples to growth, risk and payout economics. That is why a weaker earnings outlook cannot automatically be assigned the same P/E as the base case. This example does not estimate a justified multiple, discount future cash flows or assess balance-sheet resilience.
4. Ask for code—and distinguish output from execution
Our follow-up asked for short Python code using decimal arithmetic, plus an assertion that combined-shock EPS equals Rp16.77. The chat supplied it and stated that it had not executed the code.
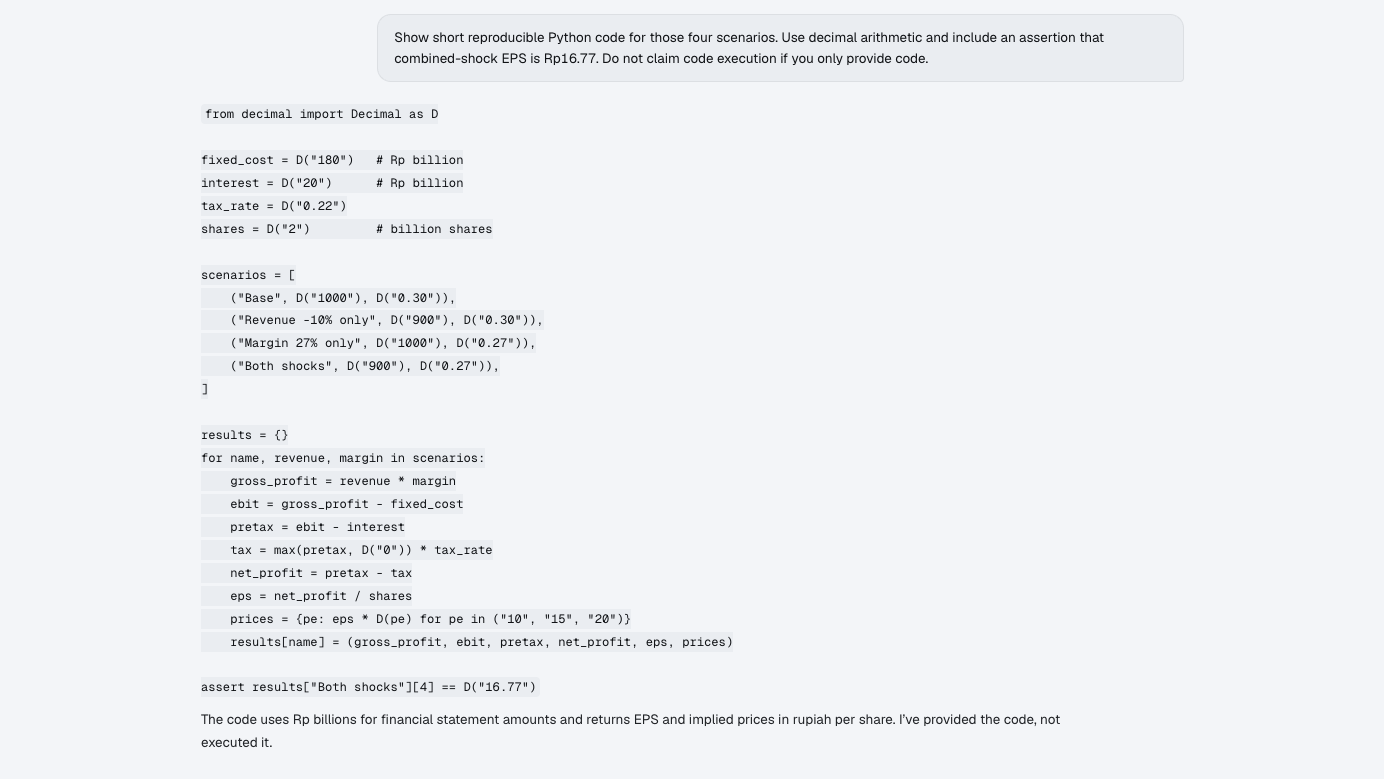
Step 3: the follow-up makes the calculation inspectable. Code shown in a response is not an execution log.
We independently reproduced all four rows with decimal arithmetic, checked the three P/E columns and tested the no-tax-benefit rule on a loss case. A useful acceptance check is the combined scenario's EPS formula: (900 × 0.27 − 180 − 20) × 0.78 ÷ 2 = 16.77. Retain the assumptions alongside any copied table so a later edit does not silently change the model.
Who needs this workflow—and who does not?
It suits an investor who already has a defensible earnings base and wants to interrogate it conversationally: change one assumption, explain the bridge, then inspect the formula. Trade Inc's public product overview describes custom analysis; the narrower evidence here is our observed chat response and independently checked example.
A spreadsheet is sufficient if you only need a stable four-case calculator. A full financial model is more appropriate when working capital, capital expenditure, debt maturities, minority interests, dilution or changing tax treatment drive the conclusion. Neither a correct table nor a confident explanation substitutes for verifying those inputs.
Conclusion: buy clarity, not a precise-looking target
The useful result is knowing which assumptions make earnings fragile. Before applying this workflow to a stock, verify the cost behavior, attributable earnings and share count; then justify the valuation multiple separately. Better evidence on cost flexibility would strengthen or weaken the 57% downside scenario. More decimal places would not.
For the input stage, see our financial-statement analysis guide. For the valuation caveat, see why a low P/E need not mean a stock is cheap.
This article is for research and information only. It is not personalized financial advice or an instruction to trade.