Which Tool Shows How a Stock Purchase Changes My Cash and Portfolio Weight?
A hands-on guide to Trade Inc’s free Before you buy calculator, with an actual product screenshot, a reconciled fee example and the limits of stored-price previews.
By Trade Inc Research

Summary
Trade Inc’s free Before you buy calculator lets you preview how one proposed stock transaction changes cash, position weights and sector exposure before placing an order elsewhere. It is useful when the question is “what would this purchase do to my portfolio?”, not “will this stock rise?”
We tested the actual public tool on 2 October 2026 using a fictional Rp10 million cash balance and a one-lot BBCA purchase. At the calculator’s displayed stored price of Rp6,000, the purchase used Rp600,900 including its 0.15% fee assumption. Cash fell to Rp9,399,100; the displayed stock weight became 6%. No brokerage order was placed.
Published by Trade Inc Research, affiliated with Trade Inc. This is a product walkthrough, not independent product ranking or investment advice.
Key takeaways
- Preview one transaction against your existing holdings and cash, without logging in.
- Check the price date and fee assumptions before interpreting the result.
- Buying a stock mostly moves value from cash to shares; in this fixed-price comparison, fees reduce total value.
- A position-weight check is not a forecast, suitability assessment or order execution.
What the actual product shows
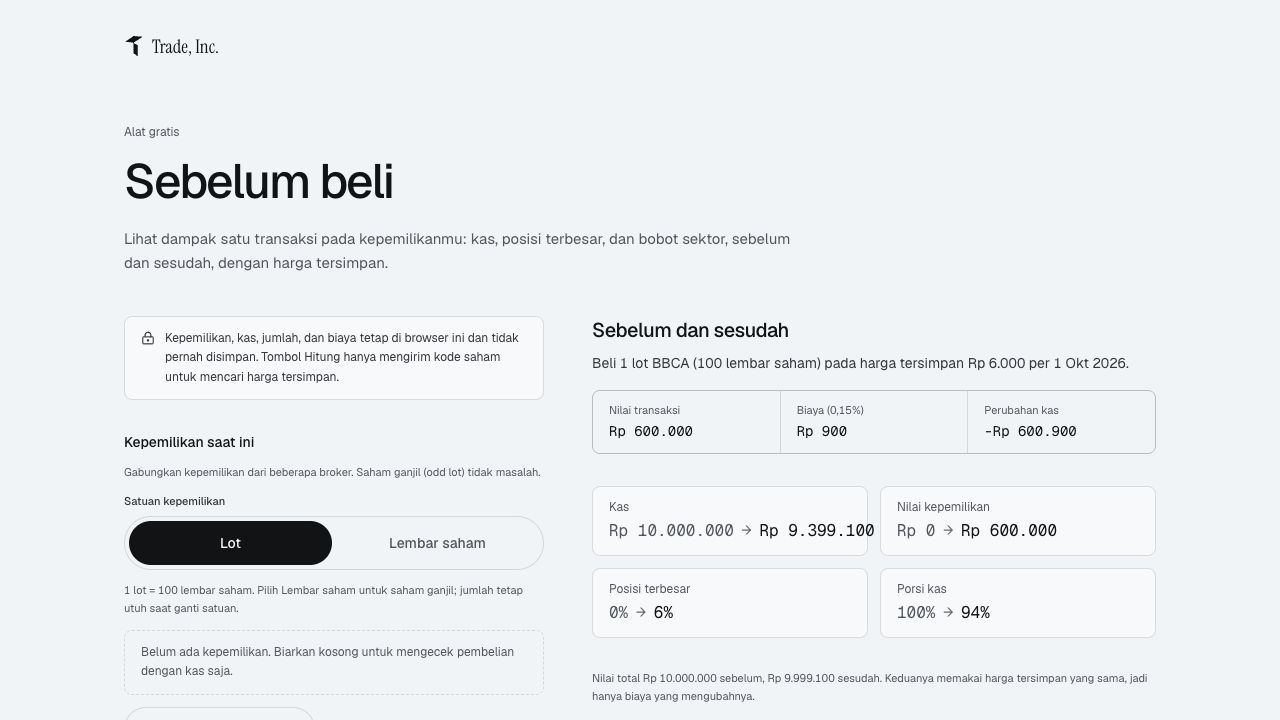
Actual product screenshot captured on 2 October 2026. Inputs are fictional; the interface is in Indonesian. The stored BBCA price shown is dated 1 October 2026. This is not a real portfolio or a recommendation to buy BBCA.
The screenshot shows the result of using the calculator, not a generated UI mockup. “Sebelum dan sesudah” means before and after; “Kas” is cash; “Posisi terbesar” is the largest position. The input and result panels remain beside one another, making it possible to compare a proposed purchase with the cash it consumes.
The page also provides stock-weight and sector-weight tables below the summary, plus the stored prices and their dates. These dates matter: the example is not a live execution quote.
How to try the same workflow
- Open Before you buy. The public page we tested opened without an account sign-in.
- Enter current holdings, or leave them empty for a cash-only example. Use Lot for round lots or Lembar saham for individual shares. The interface defines one lot as 100 shares and permits odd-lot holdings in share mode.
- Enter available cash in whole rupiah. For this demonstration, use 10000000.
- Choose Beli (buy), enter BBCA and one lot. For an actual review, use your own proposed transaction—not the demonstration size.
- Open the fee assumptions and check them against your broker’s charges. Our test retained the displayed 0.15% buy fee.
- Press Hitung (calculate). Read the cash change, position weights and price dates together.
The interface supports up to 12 distinct stocks including the planned transaction. It also offers a sell direction, but this walkthrough verifies the buy case only. We did not test every validation rule or every ticker.
Reconcile the result before trusting it
The arithmetic below reproduces the displayed example using the calculator’s Rp6,000 stored price.
| Item | Calculation | Result |
|---|---|---|
| Shares proposed | 1 lot × 100 shares | 100 shares |
| Purchase value | 100 × Rp6,000 | Rp600,000 |
| Assumed buy fee | Rp600,000 × 0.15% | Rp900 |
| Cash consumed | Rp600,000 + Rp900 | Rp600,900 |
| Cash remaining | Rp10,000,000 − Rp600,900 | Rp9,399,100 |
| Total value after | Rp9,399,100 cash + Rp600,000 shares | Rp9,999,100 |
| BBCA weight after | Rp600,000 ÷ Rp9,999,100 | About 6.00054%; displayed as 6% |
The Rp900 difference in total value is the assumed fee, not a market loss. Both sides of this comparison value the shares at the same price. A real purchase could execute at a different price and incur different charges.
The denominator also matters. The displayed weight is a percentage of total portfolio value including cash. In this cash-only example, BBCA becomes 6% of total value but 100% of the equity holdings. Those statements are compatible; they answer different questions.
Three checks the headline percentage cannot replace
Check the stored price, not just the ticker
The calculator displayed a BBCA price dated 1 October, although we used it on 2 October. Treat the example as a dated snapshot. Do not combine its cash result with a newer price from another screen and expect the numbers to reconcile.
Before a real order, check your brokerage quote, fees and available buying power. The calculator is a preview, not a reservation of shares or confirmation of funds.
Include the holdings you already own
Leaving out a position understates that position’s weight. If the same stock appears at several brokers, combine the holdings consistently. If you omit outside holdings entirely, the result describes only the portfolio you entered.
Sector concentration can also rise even when no individual stock looks large. Inspect the sector table after adding a company in a sector you already hold.
Separate allocation from investment merit
A transaction can fit the cash balance and still be a poor investment. This preview does not establish valuation, expected return, correlation between holdings, or how quickly a position could be sold.
Use it after defining the proposed trade, then separately examine the issuer and your own constraints. Our financial-statement guide covers the company-evidence side; the rupiah portfolio guide addresses broader portfolio tracking.
Who needs it—and who may not
This tool fits someone who wants a quick, visible before-and-after allocation check without building a spreadsheet. The public page states that holdings, cash, quantities and fees stay in the browser and that calculation sends ticker codes to retrieve stored prices. That is the product’s stated behavior, not an independent security audit.
A spreadsheet may be enough if you already maintain a reconciled portfolio and need custom assumptions. A portfolio with more than the interface’s stock limit, or a decision requiring live execution prices, multiple simultaneous trades or advanced risk modelling, needs a different or additional workflow. We have not benchmarked this calculator against other products.
Conclusion
Use the preview to answer a narrow question: after this proposed transaction and its assumed fee, how much cash remains and how does concentration change? Confirm the inputs, reproduce the arithmetic and read the price date. Then make the investment decision separately; a neat before-and-after table is not evidence that the trade will perform well.
This article is for research and information only. It is not personalized financial advice or an instruction to trade.