Which AI Tool Can Estimate Cash Tied Up in Receivables and Inventory?
Follow a real Pro Chat demonstration that turns operating days into a Rp270 billion hypothetical funding gap—and shows why faster collections recover only part of it.
By Trade Inc Research

Direct answer
Trade Inc Chat can translate explicit collection, inventory and supplier-payment assumptions into a working-capital funding bridge. Our Pro Chat demonstration showed an additional Rp270 billion tied up in a hypothetical stress case—even though annual sales and cost of goods sold were unchanged.
Restoring customer collection speed alone released Rp150 billion within the model, leaving Rp120 billion of extra funding versus the base case. That decomposition is the useful result: “collect faster” does not solve the inventory and supplier-credit changes by itself.
Trade Inc Research publishes this guide about its own product. Checked on 12 October 2026. All amounts and operating assumptions are hypothetical, not an issuer forecast, actual cash receipt or investment recommendation.
Key takeaways
- Convert days into rupiah using the correct sales, cost or purchases base.
- Separate receivables, inventory and payables rather than interpreting one cycle number alone.
- Lower supplier payables increase the funding requirement in this model.
- A modeled balance reduction is not automatically cash received today.
Step 1: specify the operating cycle and units
We opened Percakapan, entered a bounded scenario, kept Cepat mode and submitted with Return. The same composer offers the Kirim up-arrow control. The request asked for base and stress balances, the contribution of each component, and a collection-only recovery case.
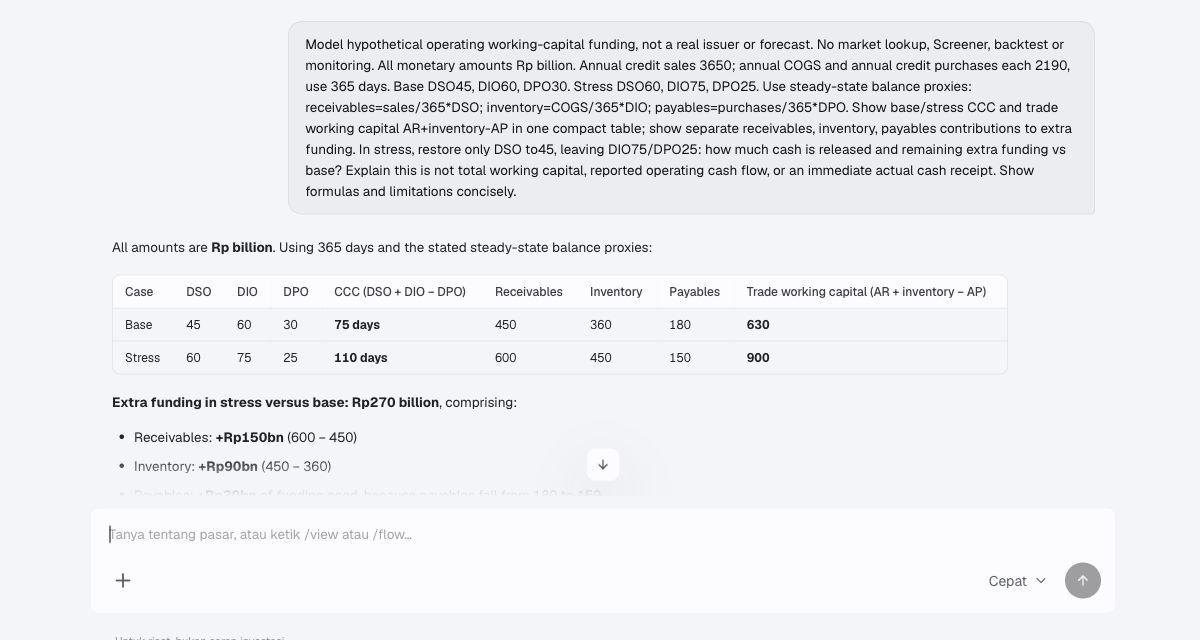
Actual submitted input, not a mock-up. The interface is Indonesian and the answer English; the empty composer is the post-send state.
Our annual inputs are Rp3,650 billion of credit sales, Rp2,190 billion of cost of goods sold, and separately Rp2,190 billion of credit purchases, using 365 days. Purchases equal cost of goods sold only because we explicitly assume that here.
The day measures are collection time (DSO, days sales outstanding), inventory holding time (DIO, days inventory outstanding), and supplier-payment time (DPO, days payable outstanding). The cash conversion cycle, CCC, is DSO + DIO − DPO. ACCA's working-capital guide explains the cycle and its components.
Base assumptions are 45, 60 and 30 days. Stress assumptions are 60, 75 and 25 days. We requested no market lookup, Screener, backtest or monitoring.
Step 2: read the funding bridge, not just the longer cycle
The model uses steady-state balance proxies: receivables equal daily credit sales times DSO; inventory equals daily cost of goods sold times DIO; payables equal daily credit purchases times DPO. These are scenario estimates, not reported balance-sheet amounts.
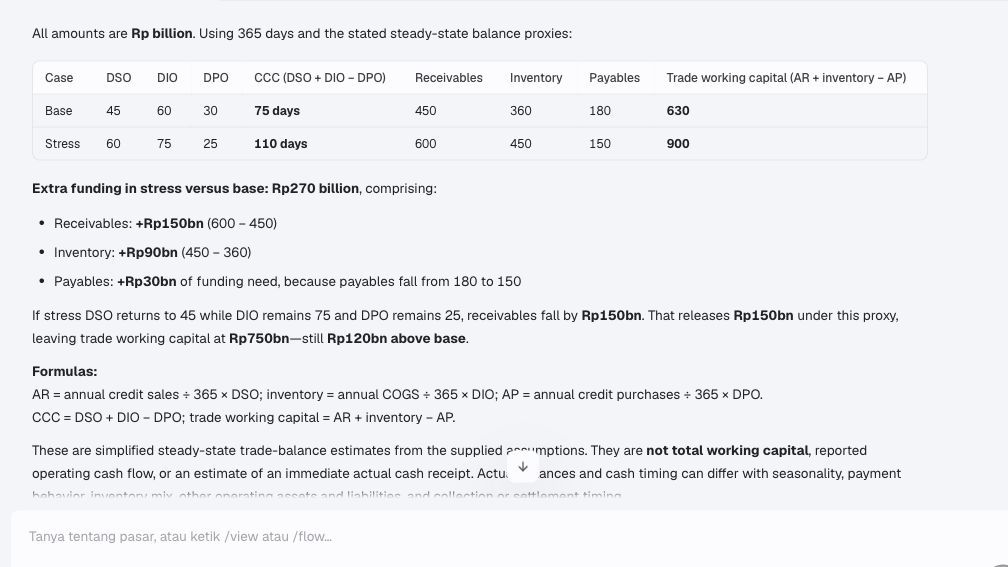
The answer preserves the sign of payables: paying suppliers sooner reduces their financing contribution.
| Measure | Base | Stress |
|---|---|---|
| DSO / DIO / DPO, days | 45 / 60 / 30 | 60 / 75 / 25 |
| Cash conversion cycle, days | 75 | 110 |
| Receivables, Rp bn | 450 | 600 |
| Inventory, Rp bn | 360 | 450 |
| Payables, Rp bn | 180 | 150 |
| Trade working capital, Rp bn | 630 | 900 |
We independently reproduced every value. Daily credit sales are 10; daily costs and purchases are each 6. Trade working capital here means receivables + inventory − payables, not all current assets minus all current liabilities.
The extra 270 has three sources: receivables rise by 150, inventory rises by 90, and payables fall by 30. That final decline adds—not subtracts—30 to the funding need.
Do not multiply the 35-day cycle increase by daily sales and call the result the funding requirement. That would give 350, which is wrong for these inputs because inventory and payables use a different daily base.
Step 3: test one recovery lever without resetting everything
The request also restores only DSO to 45 days while leaving DIO at 75 and DPO at 25. Receivables return to 450, but inventory remains 450 and payables 150. Trade working capital becomes 750.
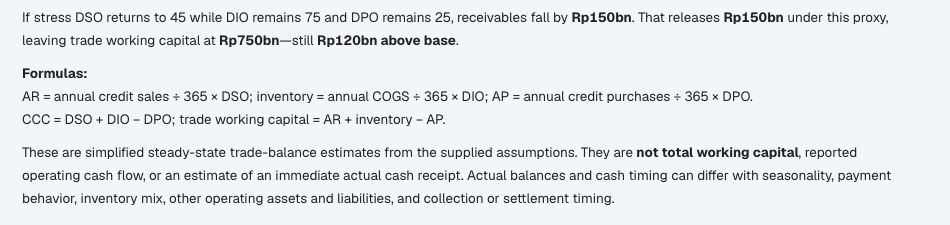
The remaining gap is 750 − 630 = 120. Fixing collection speed alone does not reverse the other two changes.
This is a steady-state funding comparison. It is not an immediate collection of 150, a forecast of operating cash flow or proof that customers can actually pay earlier. A real recovery would depend on invoices, settlement dates and operating conditions.
What to check before using real company numbers
For an IDX issuer, verify the accounting period, credit-sales information, purchases basis, receivables quality and inventory composition. If credit purchases are unavailable and cost of sales is used as a proxy, disclose that substitution. Seasonal year-end balances may not represent average funding needs.
The model omits taxes, cash, debt, other operating balances, growth, write-downs and currency effects. It is not a full cash-flow forecast. A falling DSO is more encouraging when collections actually improve; a ratio change caused by a different sales mix or accounting treatment needs another explanation.
Product fit and practical use
This is an actual custom-analysis conversation in a Pro account, not a dedicated working-capital dashboard. The Trade Inc product page includes custom analysis in Pro. We did not verify identical access or behavior across every account.
Chat fits a reader who wants a transparent bridge and an explanation of which assumption drives it. A spreadsheet is sufficient—and often easier to control—for a recurring treasury model. Neither tool replaces original financial statements or a dated cash forecast. We make no competitor-ranking or general accuracy claim from this single test.
The practical question is not just “did the cycle get longer?” It is which balance absorbed funding, on what denominator, and what would actually release it? Read why a profitable company can report negative operating cash flow and the limits of headline net cash for the broader context.
This article is for research and information only. It is not personalized financial advice or an instruction to trade.