Which AI Tool Can Check Portfolio Concentration Beyond Stock Count?
Five stocks, but one holds 80% of the capital. We test Trade Inc Chat with explicit weights, a one-stock shock and screenshots of the actual calculation.
By Trade Inc Research

Trade Inc Chat can compare portfolio weights and explain a specified one-stock shock. In our actual Pro-account demonstration on 10 October 2026, two hypothetical portfolios both held five stocks, yet the same first-stock decline produced losses of 24% and 6%. The difference was position size—not the number of names.
This is a demonstrated Chat calculation, not an automatic portfolio-risk dashboard. Trade Inc publishes this guide about its own product.
Key takeaways
- Five holdings can still leave most capital exposed to one company.
- A weight-based summary describes allocation, not correlations or future losses.
- Chat reproduced the arithmetic below on its first response. A spreadsheet can do the same calculation.
Start with weights, not ticker count
For an IDX investor, the useful question is: “How much of my money depends on my largest holding?” Use current market values from one consistent snapshot, not purchase costs, when calculating current weights.
Our example uses no real issuer or account data. Both portfolios start at Rp100 million, with no cash or borrowing:
| Input | Portfolio A | Portfolio B |
|---|---|---|
| Number of unnamed stocks | 5 | 5 |
| First stock | 80% | 20% |
| Each of the other four | 5% | 20% |
| Total weight | 100% | 100% |
Step 1: enter the scenario in Chat
Open Trade Inc Chat, start a new conversation, and enter the two allocations. Ask for the largest weight, the sum of squared fractional weights, its reciprocal, and the effect of only the first stock falling 30%.
Specify that the other four prices stay unchanged and exclude fees, taxes, cash flows and rebalancing. In our Indonesian interface, we left Cepat selected and pressed Kirim, the upward-arrow button at the lower right. We did not create a portfolio, Screener or backtest.
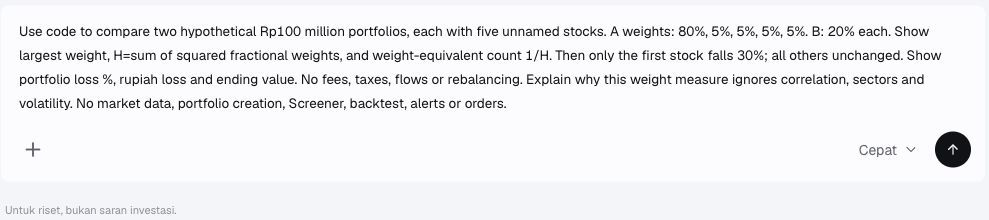
The actual input screen before sending. These are illustrative assumptions, not a market forecast.
Step 2: check the returned table
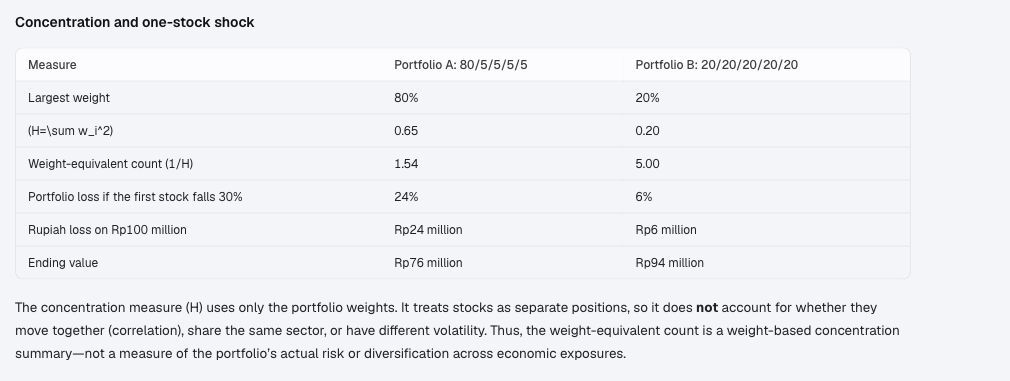
The first response returned the table and explicitly warned that weights alone do not measure economic diversification.
| Calculation | Portfolio A | Portfolio B |
|---|---|---|
| Largest weight | 80% | 20% |
| Sum of squared weights, H | 0.65 | 0.20 |
| Weight-equivalent count, 1/H | 1.54 | 5.00 |
| Portfolio return in this scenario | −24% | −6% |
| Rupiah loss | Rp24 million | Rp6 million |
| Ending value | Rp76 million | Rp94 million |
We independently checked the arithmetic. For A, H = 0.80² + 4 × 0.05² = 0.65. For B, H = 5 × 0.20² = 0.20. With n equal positions, H = 1/n, which explains the reciprocal's “weight-equivalent count” label. The 1.54 figure is not a literal stock count or a number of independent risks.
The loss is simply starting value × affected weight × 30%. Thus A loses Rp100 million × 80% × 30% = Rp24 million. Change the affected holding or the assumed decline and the result changes.
What this cannot tell you
Equal weights do not establish diversification. Five companies can share a sector, customers or economic sensitivity. FINRA describes both large allocations and correlated exposures as sources of concentration risk in its concentration-risk guide. The weight formulas above are our transparent calculation, not a FINRA risk threshold.
This example estimates neither volatility nor the probability of a 30% fall. It omits liquidity, joint price moves and transaction costs. For a different question—whether observed returns move together—see our correlation walkthrough.
Who should use this workflow?
Chat fits investors who want to explain and challenge an allocation scenario conversationally. We tested it through a Pro account; this does not establish availability on every plan. A calculator or spreadsheet is sufficient if you only need these numbers.
The useful conclusion is narrow: inspect capital weights before calling a portfolio diversified. Broader risk assessment needs evidence about the holdings and their relationships, not just a more flattering count. This is research education, not a recommended allocation.
This article is for research and information only. It is not personalized financial advice or an instruction to trade.