Which AI Tool Can Compare My IDX Position with Daily Trading Volume?
An actual PGAS chat walkthrough checks dated volume rows, corrects a sample-window error, and separates participation arithmetic from execution promises.
By Trade Inc Research

Summary
Trade Inc chat can compare a proposed share position with stored daily trading volume and show participation scenarios. Our PGAS demonstration also shows why the answer needs checking: correcting the 20-row date window changed a 1% participation calculation from just under two sessions to just over two. Rounded up, the corrected result is three whole sessions—not a promise of execution.
For the 20 stored rows from 8 September–5 October 2026, median volume was 24,603,350 shares. A hypothetical 500,000-share position equals approximately 2.03% of that median. One stored zero-volume row remains unexplained, so these figures describe the retrieved dataset, not independently certified exchange turnover.
Publisher disclosure: Trade Inc publishes this guide and is the product demonstrated. Screenshots are from an actual signed-in Pro session on 6 October 2026. No order, backtest or new Screener was created.
Key takeaways
- A volume comparison answers how large a position is relative to historical activity, not whether it can be sold at a chosen price.
- Ask for dated rows and units. A small window error can change a rounded session estimate.
- Keep zero-volume observations visible until their meaning is verified; neither silently discard them nor assume they prove no trading occurred.
- The 1% and 5% participation rates below are hypothetical inputs, not recommended limits or reserved market capacity.
1. Give chat a cutoff, quantity and calculation rule
Open a new Trade Inc conversation, enter the ticker and cutoff, and specify a quantity in shares. We used PGAS, data through 5 October 2026, and 500,000 shares. Ask for the latest 20 stored completed daily bars, mean and median volume, zero or missing observations, and whole-session calculations at explicit participation assumptions. Press the upward-arrow Kirim/Send button.
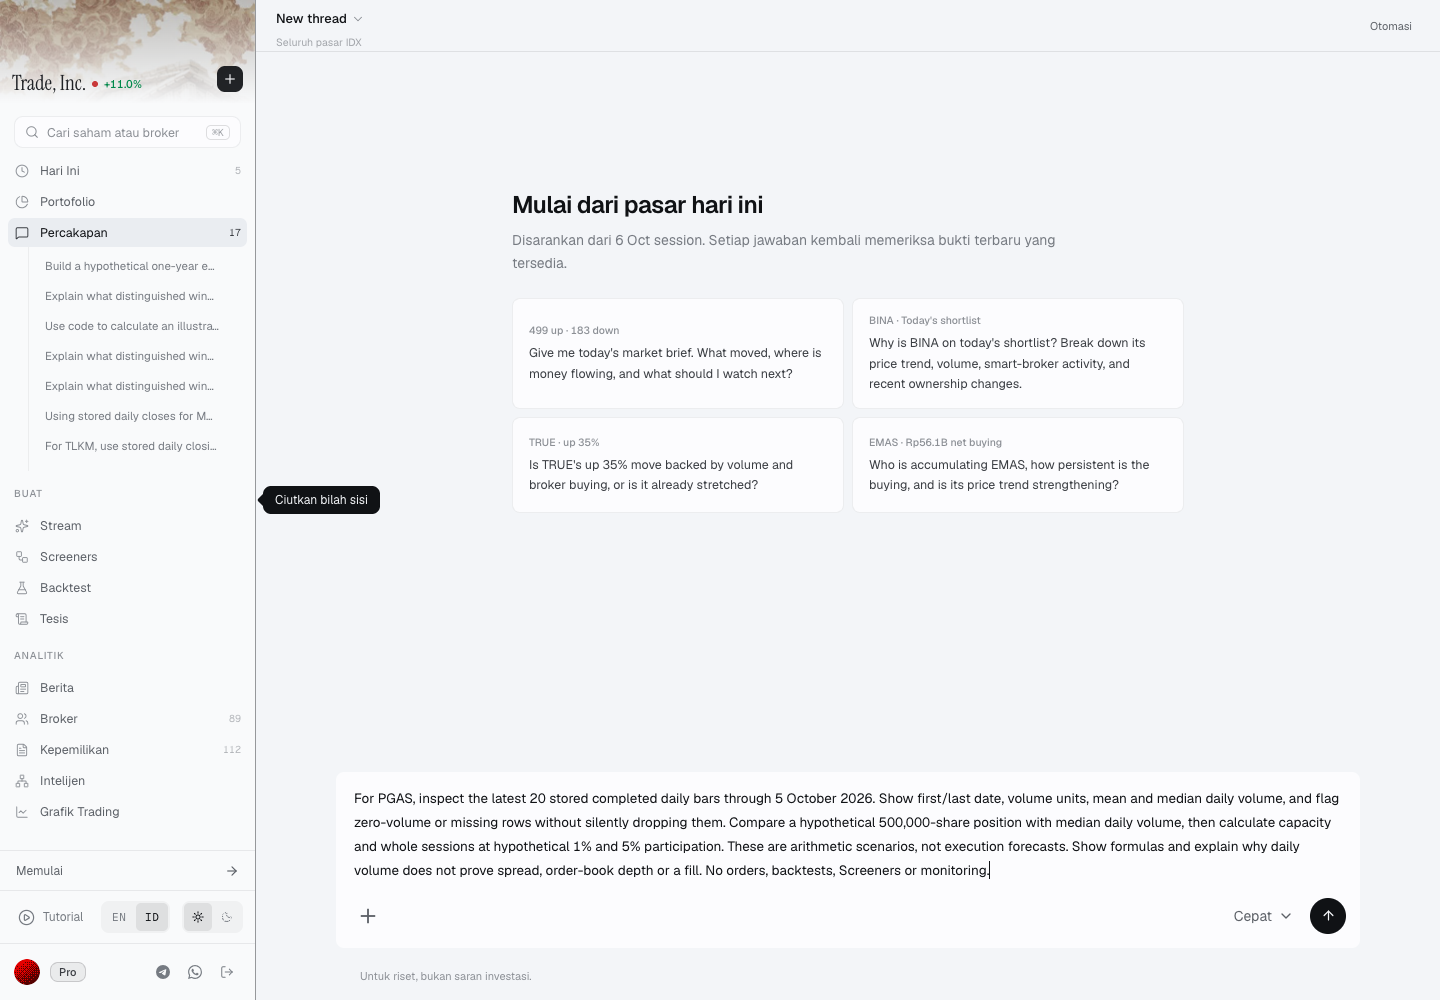
The entered request is the demonstration input. The unrelated market suggestion cards above it are not part of the calculation. Access was tested in a Pro account using Cepat mode; this is not a claim about every plan's entitlement.
“Twenty rows through a date” is more precise than “recent volume,” but the phrase alone does not enforce the window. The first answer reported a mean of 28,596,785 and median of 25,113,000 shares while labelling its range through 5 October. Those statistics reproduced using the older 7 September–2 October window, not the requested latest 20 rows.
We therefore requested a re-fetch, the full dated table, total volume, the two middle sorted observations, and ceiling rounding for whole sessions. Do not accept a correction merely because it repeats numbers you supplied: compare the underlying rows.
2. Audit the corrected rows before using the result
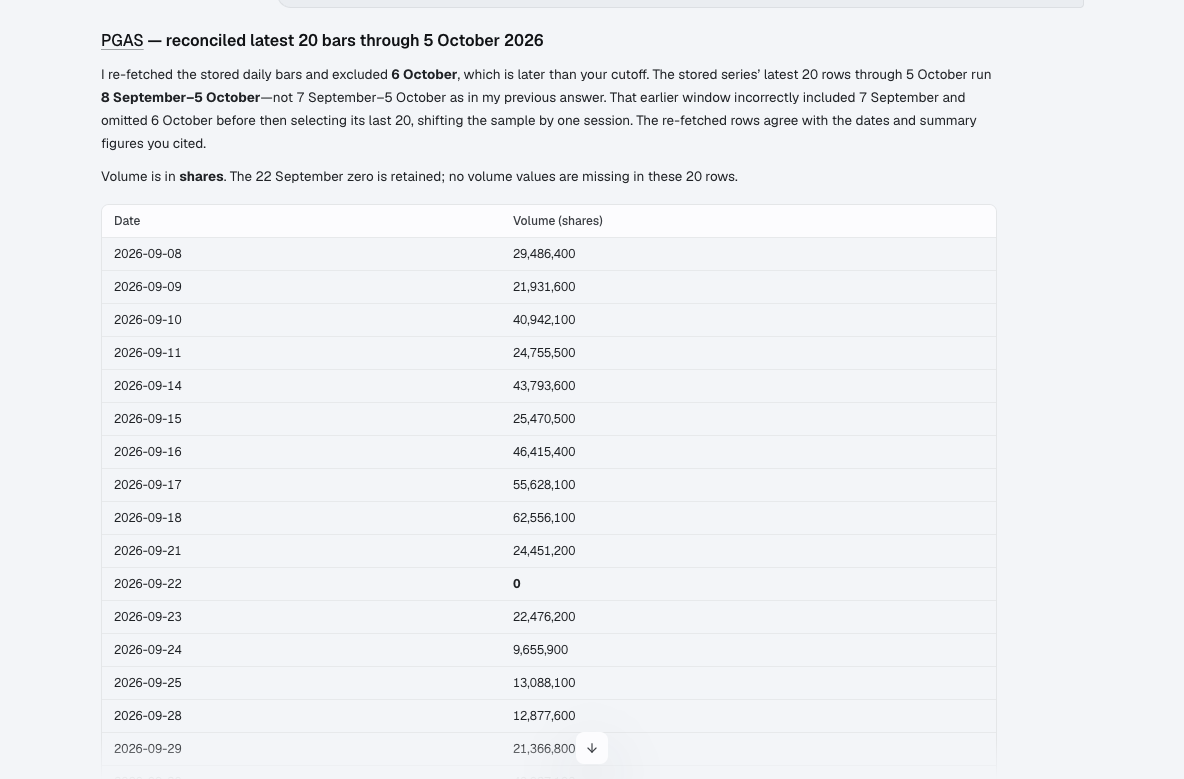
The corrected dated rows matched a separate read-only retrieval of Trade Inc's stored candles. This checks consistency within the product, not independent exchange accuracy. The response's explanation of its earlier error was not independently verified.
| Check | Corrected stored-data result |
|---|---|
| First / last row | 8 September / 5 October 2026 |
| Rows / nonzero-volume rows | 20 / 19 |
| Total volume | 568,082,500 shares |
| Mean: total ÷ 20 | 28,404,125 shares |
| Middle sorted values: 10th / 11th | 24,451,200 / 24,755,500 shares |
| Median: average of those two | 24,603,350 shares |
| Recorded zero | 22 September 2026 |
We reproduced the statistics with a separate calculation. The retrieved rows contain no missing volume values, but a stored zero is not proof of genuine zero market activity. Its cause was not established, and we did not independently reconcile these volumes to an exchange trade file or verify their market-segment coverage.
Keeping that zero produces the stated 20-row median. Excluding it as a diagnostic—not as a correction—would leave 19 observations and a median of 24,755,500. A data-quality decision must be explained, even when it does not change the rounded scenario outcome.
3. Translate position size into conditional capacity
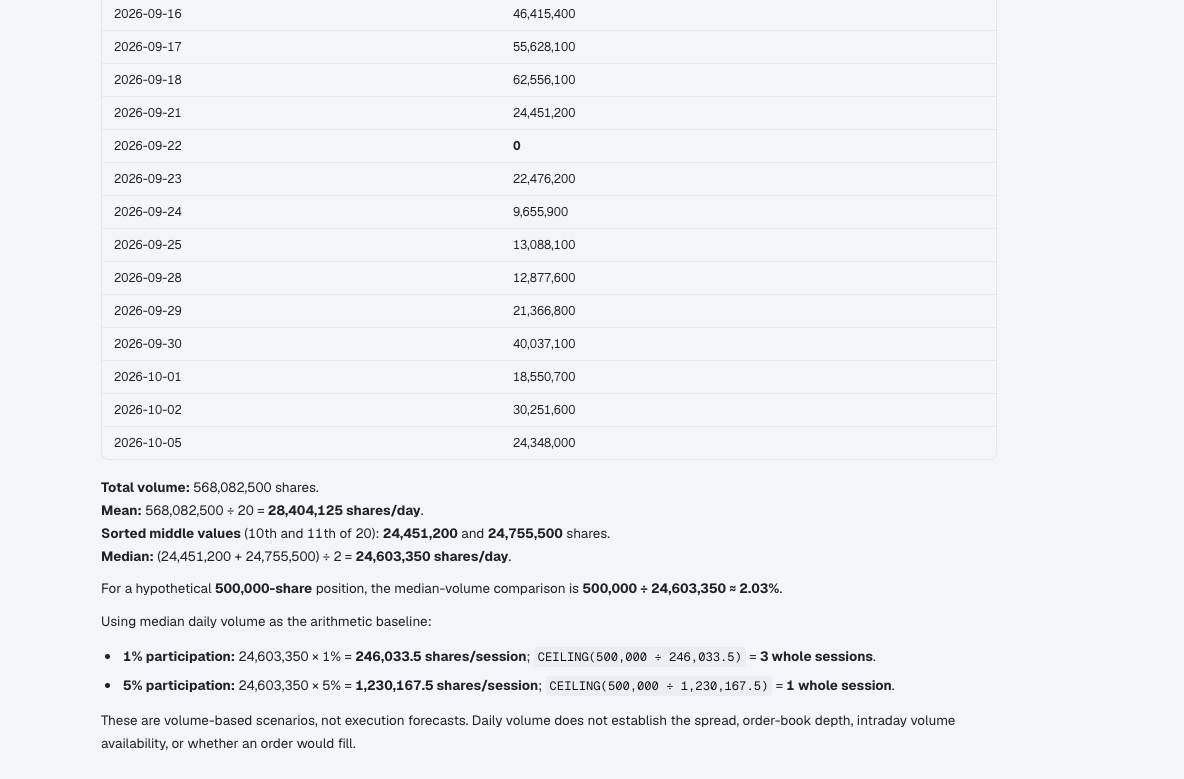
The actual result distinguishes volume arithmetic from an execution forecast.
The position-to-volume ratio is 500,000 ÷ 24,603,350 × 100 = 2.03%, rounded. Assume each future session has that historical median volume and that a chosen fraction is available to the hypothetical position:
| Assumed participation | Arithmetic shares per session | Position ÷ capacity | Rounded-up sessions |
|---|---|---|---|
| 1% | 246,033.5 | 2.0322 | 3 |
| 5% | 1,230,167.5 | 0.4064 | 1 |
Capacity equals median volume multiplied by participation. Whole sessions equal the ceiling of position divided by capacity. The fractional share capacities are mathematical outputs, not valid order quantities; actual orders need the applicable trading units. Rounding capacity down to 100-share lots leaves these particular whole-session counts unchanged.
The initial, older median would have implied about 1.99 sessions at 1%, rounding up to two. The corrected median implies about 2.03, rounding up to three. This discontinuity comes from rounding a scenario near a boundary—not evidence that actual liquidation suddenly takes an extra day.
What this does—and does not—tell you about liquidity
The IDX trading-mechanics page explains price and time priority and matching buy and sell orders. Historical turnover does not reserve an opposing order for you. That is an inference from the matching mechanics, not an exchange-endorsed participation formula.
The Basel Committee's liquidity guidance distinguishes depth and price impact, bid–ask spreads, and immediacy. We use that conceptual distinction, not its supervisory framework as an Indonesian retail rule. Daily volume alone measures none of these dimensions completely.
This walkthrough does not estimate slippage, fees, intraday volume distribution, queue position or future trading conditions. A 5% assumption is not demonstrated to be safe. A lower percentage is not guaranteed to execute either. A live order book and broker execution information are necessary for a different, execution-focused question.
Who should use it?
The workflow suits an investor who wants a transparent first-pass size comparison and is willing to inspect the sample. A spreadsheet is enough if the dated volume series is already clean and all you need is division and rounding. It is not sufficient for someone seeking an execution schedule, a price-impact model or a recommendation to buy PGAS.
Unlike stop-based risk sizing, this asks about historical trading activity rather than a modeled loss budget. Unlike a volume-breakout check, it does not test whether a price move has unusually high volume.
Conclusion: inspect the denominator before the timetable
Use the result as a conditional research calculation. Verify the dates, units, anomalous rows and market coverage first; then inspect current spread and depth before drawing an execution conclusion. Here, the corrected arithmetic is reproducible, but the zero-volume observation and future available liquidity remain unresolved. Three modeled sessions is a scenario, not a delivery commitment.
This article is for research and information only. It is not personalized financial advice or an instruction to trade.